This article will go through reporting for your multi-registration event.
Overview
Multi-registration templates are an add on to your plan and usually incurs a charge for one to be created and added to your account. If you want to know more about Multi-registration events and find out how you can have a Multi-registration template in your account, please reach out to your Account Manager and they will advise you further.
Once you have built your multi registration event by following our guide, you are able to promote your registration link to gain reporting.
Notes
After the event has taken place, and the on-demand has been created for each, you may want to revert back to the single event-based reporting, as to ensure the multi-registration URL is correct, as we would remove the live sessions from the multi registration, and only keep the on demands, so live reporting would remove itself from that multi-registration event reporting - as reporting will only include the sessions that are included within the multi registration URL.
Viewing Multi Registration Event Reports
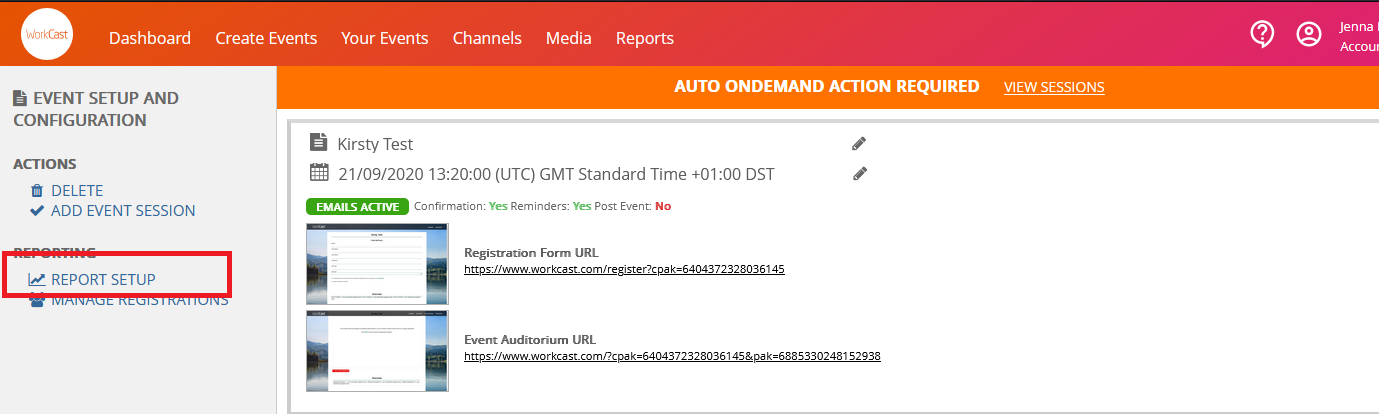
From the Events tab, click on the multi-registration event you wish to view a report for. Clicking on Report Setup will take you directly to the event reporting page where certain standard default report items are selected for you.
1. From the Dashboard click View your events or alternatively click on the Your Events Tab
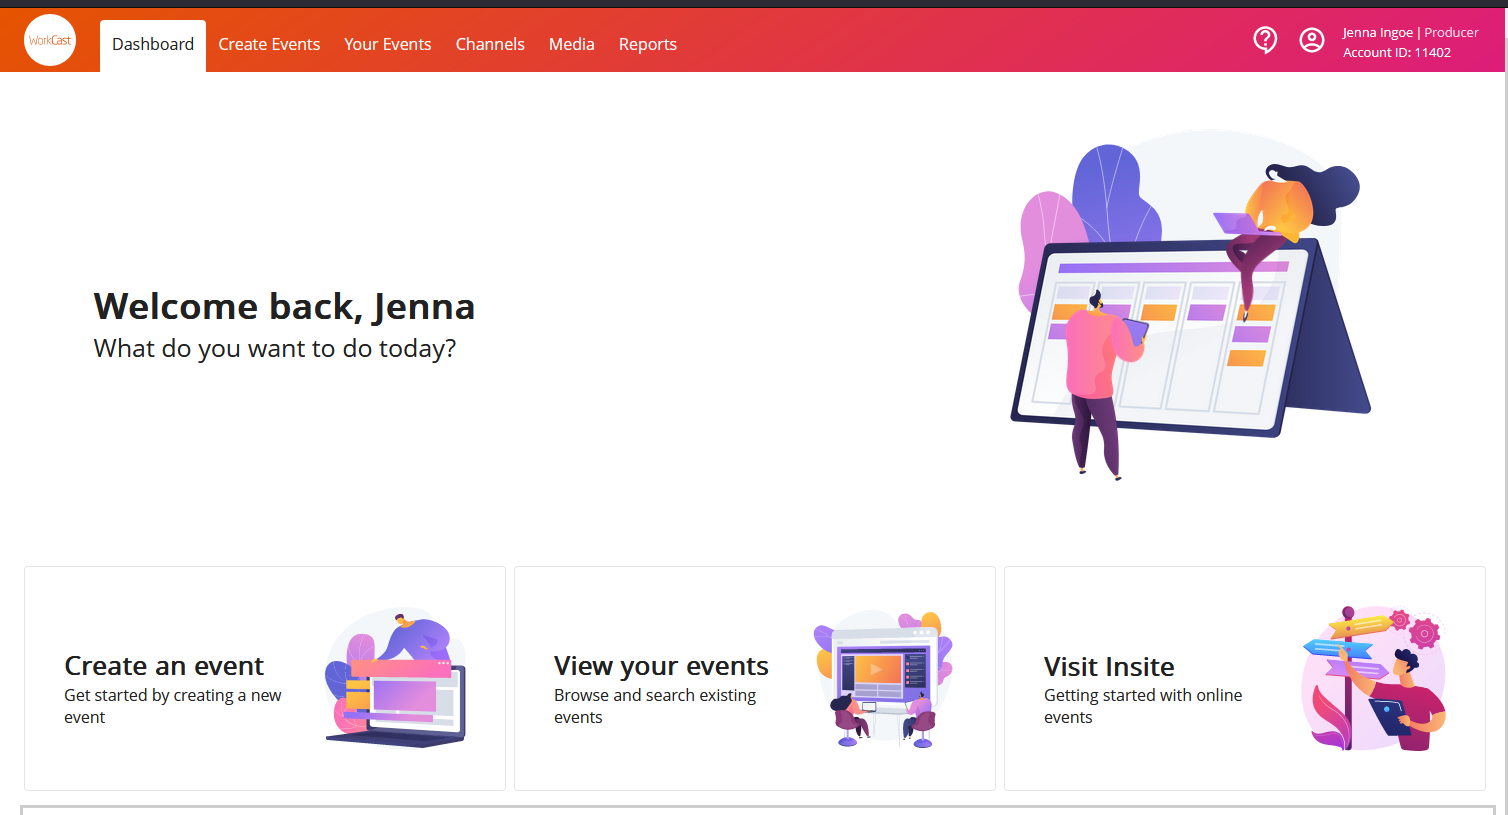
2. Click on the event that you would like to view reporting.
For you to search, we would advise doing a date range, so it shows you:
- The overall multi-registration event (which included all events you require it to)
- and also the individual events included within the multi-registration
It will look something like the below: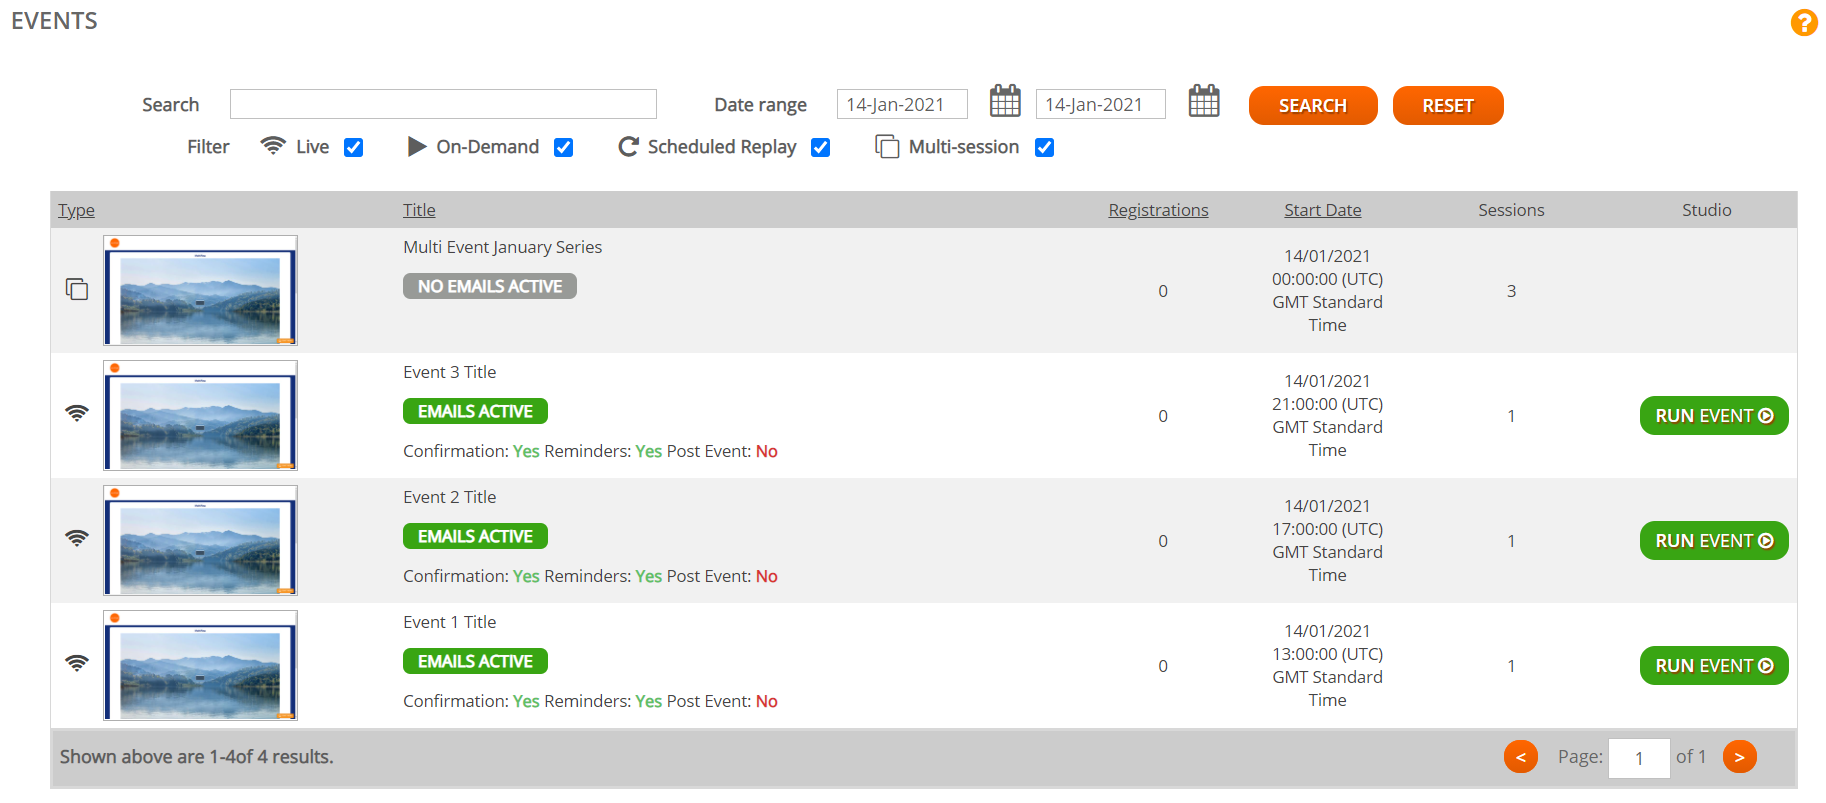
If you want to view single event-based reporting, you are able to click into the individual events to do this.
However, if you want to view reporting all together for your multi registration event, we would advise clicking into the one with all event sessions included.
3. Click on the Report Setup button
4. You are now taken directly to that multi registration events specific reporting dashboard where you will find default report items are selected for you (standard reporting).
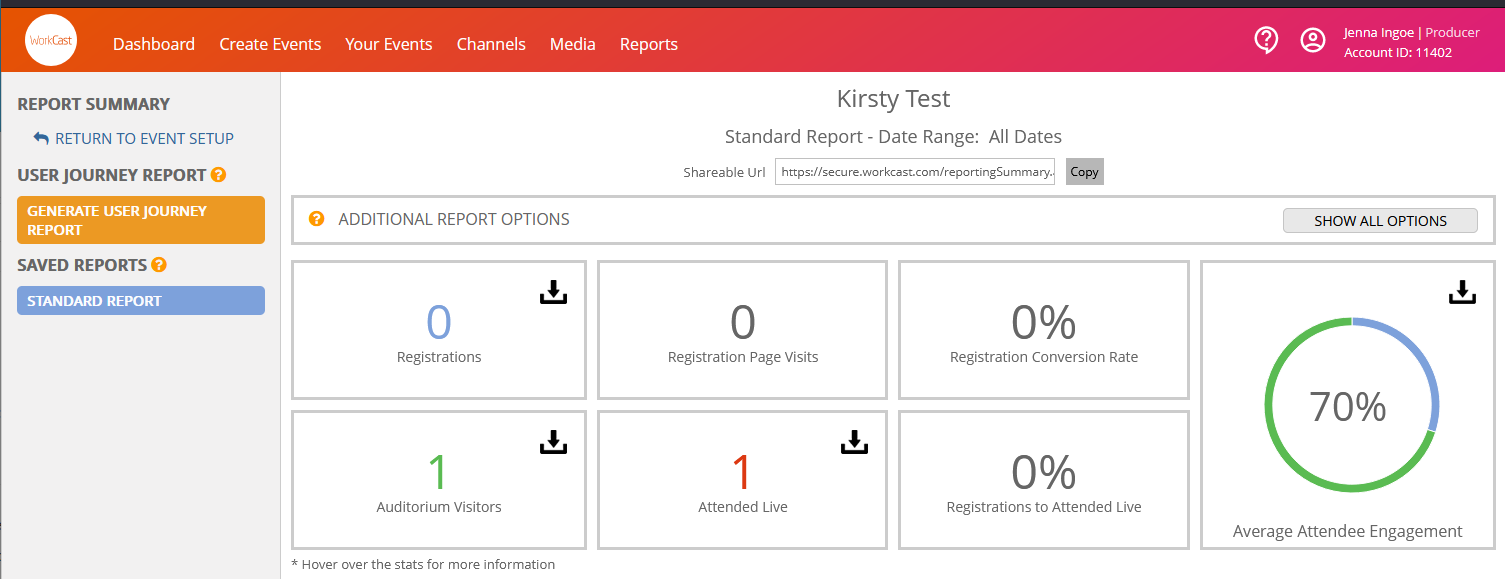
The above shows the top-level stats. If you scroll down you will see individual report graphs and have the ability to download this data. These specific reports are shown further down the page.
Understanding your Reports and Engagement Score
Top Level Event Statistics
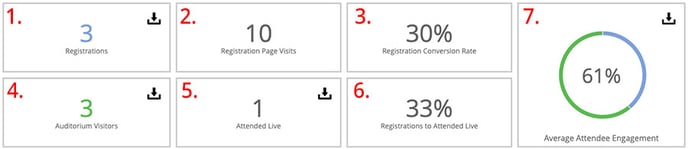
1. Registrations - The total unique registrants for the event. If an individual registers more than once with the same email address their original details will be updated and they will only appear as a single registration. You can click the Download icon which will generate a report you can view online or download as a .csv file. Users registered via the API or bulk upload will also appear on the registrant's list.
2. Registration Page Visits - The total number of times the event registration page has been visited. A single person may attend the registration page multiple times. If users are registered on a non-WorkCast registration page, so this could be via the API or bulk upload, you may see a lower registration page visits number to the total number of registrants.
3. Registration Conversion Rate - The total number of registrations divided by the total number of registration page visits. This statistic will help you understand if items such as your event title, amount of content, and the number of registration fields are helping to convert visitors to the page into registrations.
4. Auditorium Visitors - The total unique number of attendees who have visited the main event presentation page at any time prior, during, or after the live event date and time. You can click the Download icon which will generate a report you can view online or download as a .csv file.
5. Attended Live - The total unique number of attendees who have attended the event during the live event date and time (this includes 1 hour prior and 1 hour after the event duration time). You can click the Download icon where you can view online or download as a .csv file.
Important: Attended Live stats will only populate 1 hour after the end duration time the event has been configured for.
6. Registration to Attended Live Conversion Rate - The total number of registrations divided by the total number of live attendees.
7. Average Event Engagement - The total event engagement is based on the average of individual attendees' engagement scoring. You can click the Download icon to view the total event engagement for all auditorium visitors and attendees. Individual attendee's engagement scores can be viewed on the Auditorium Visitors and Attended Live reports.
An individuals Engagement is calculated upon the following event items:
- Event Viewing Duration (60%) - If you have a live event scheduled for 1 pm with a 30-minute duration, and an attendee is active on the page for the whole of that time period they will achieve a score of 60% for the event viewing duration. If they attended for only 15 minutes of the live event duration time they would achieve a score of 30% for the event.
- Polls Answered (10%) - If you answer one or more polls during an event you will gain a score of 10% for polls answered.
- Submitting a text question/chat message (20%) - If you ask one or more questions or submit one or more chat messages (event setup allows for either Q&A or chat) you will gain a score of 20%.
- Document & Link Downloads (10%) - If you click one or more document or link downloads in the documents section of the event you will gain a score of 10%.
Total Individual Engagement Score = Event Viewing Duration % + Polls Answered % + Question or Chat Asked % + Document/Link Download %
NOTE: If your event is configured without one of the above event elements then attendees will never gain an engagement score of 100%. Attendees will stay engaged during an event the more they can interact with different event elements.
Standard Reports Overview
The standard reports that will show automatically for you are the following:
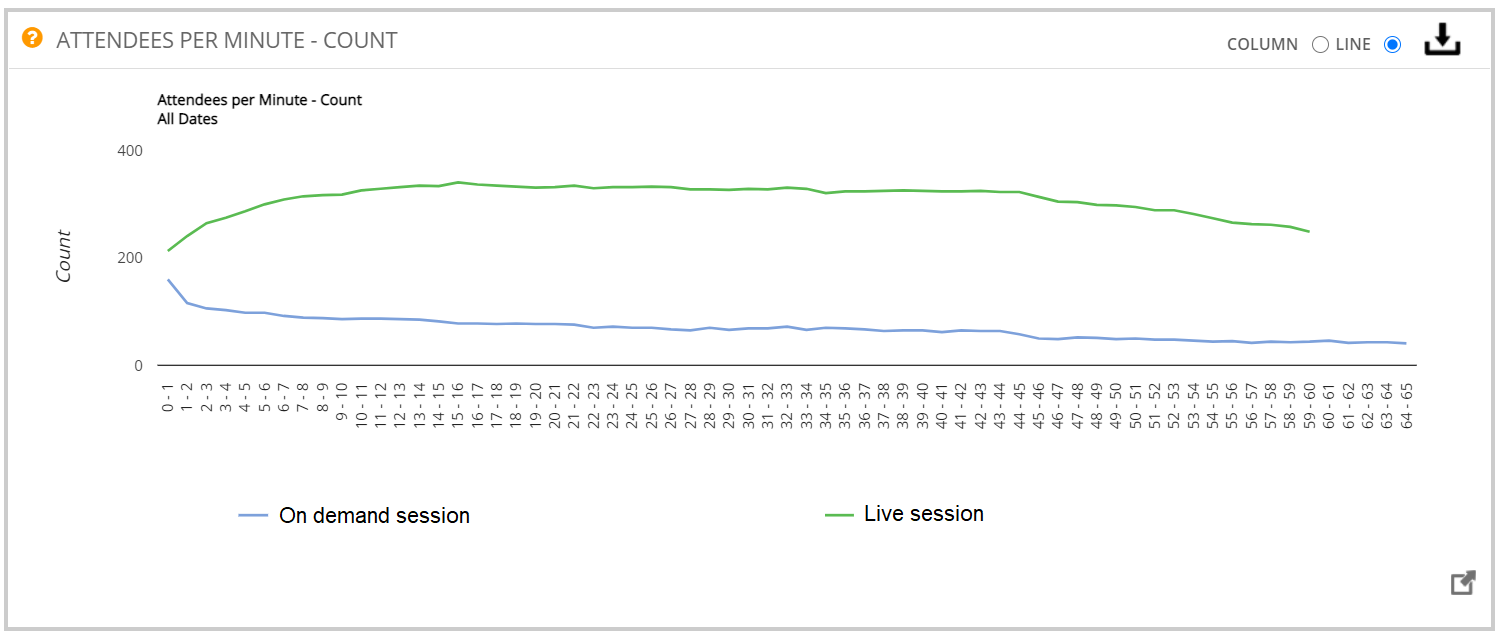
ATTENDEES PER MINUTE - COUNT
This graph shows attendee numbers counted at each minute throughout the duration of each event. Each event session is reported as an individual line. You have the option to choose a column or line view of the graph. The more events you have within your multi-registration event, the more lines will appear.
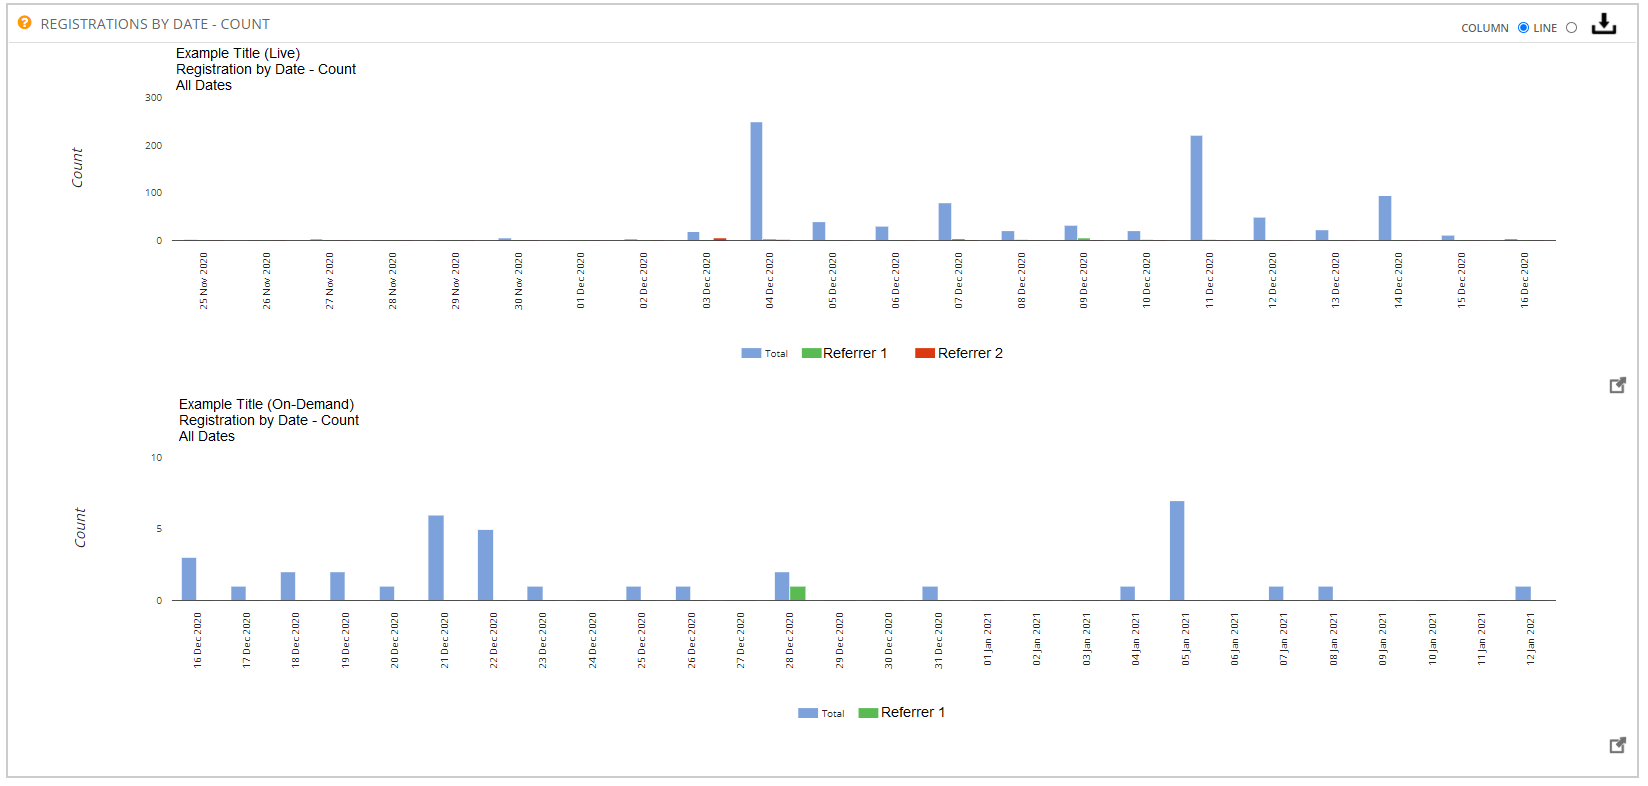
REGISTRATIONS BY DATE - COUNT
This graph shows you all registrations for your events within the multi-registration event, by date. If you have set up any registration URL referrers, these will also show in the graphs. It will show multiple graphs as you have multiple events within your multi-registration event.
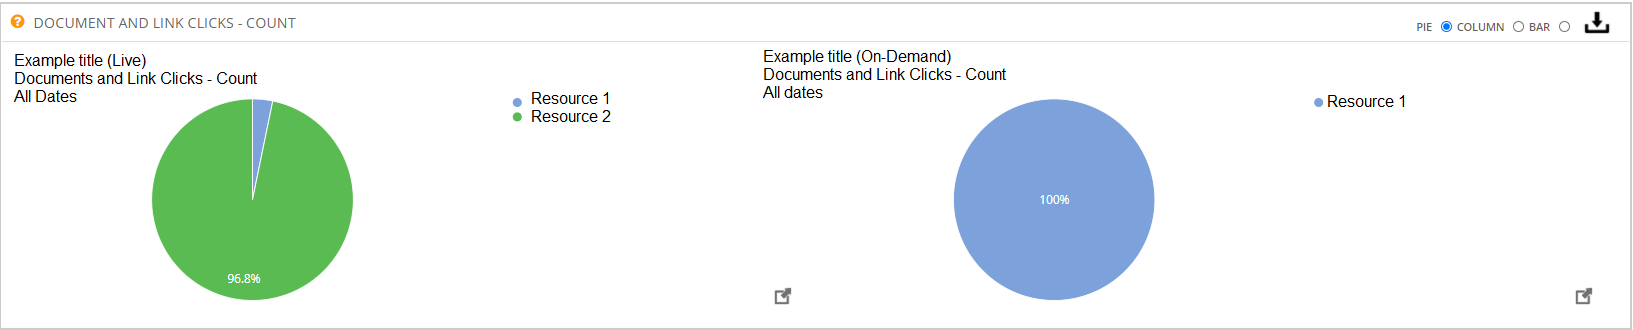
DOCUMENTS AND LINK CLICKS - COUNT
This graph shows the number of documents and links that have been clicked on via the Resources tab in the event auditorium page of each event. Again this will show multiple graphs depending on the number of events you have within your multi-registration event.
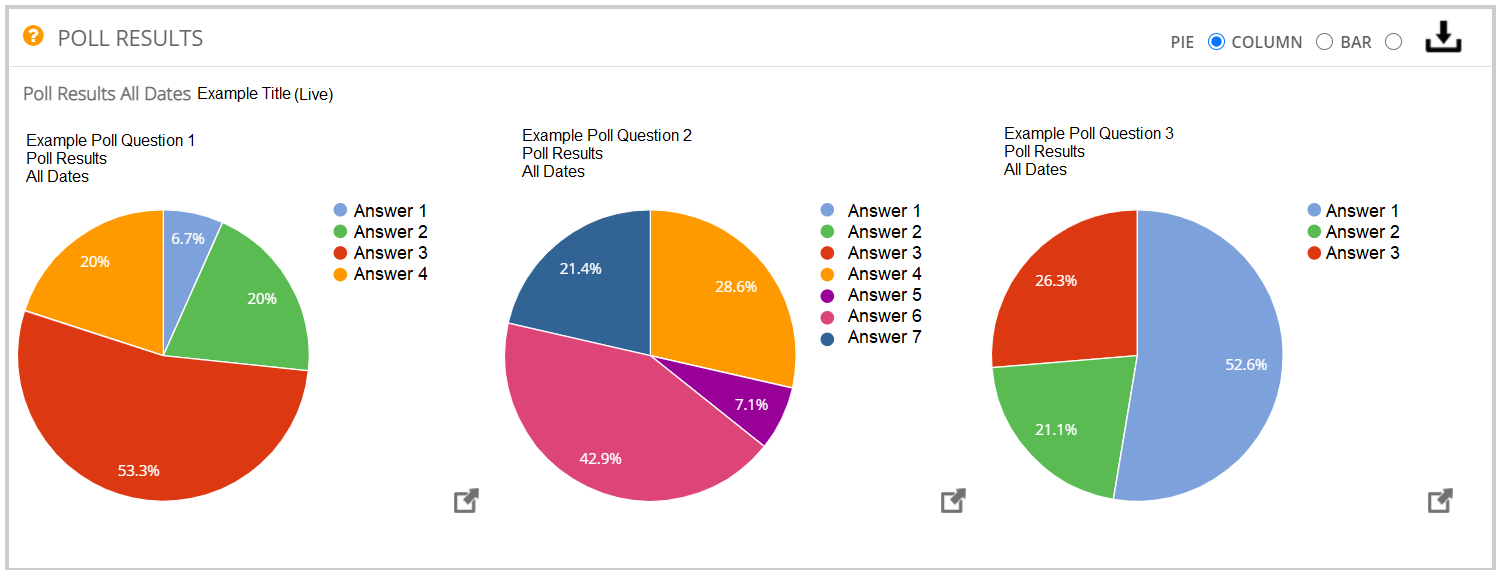
POLL RESULTS
This graph shows you the results of polls that were asked during each event. Multiple graphs will appear for the multiple events within your multi-registration event.
Note: You will not gain a pie chat for any text answer polls, but the data will appear when you view/download the report.
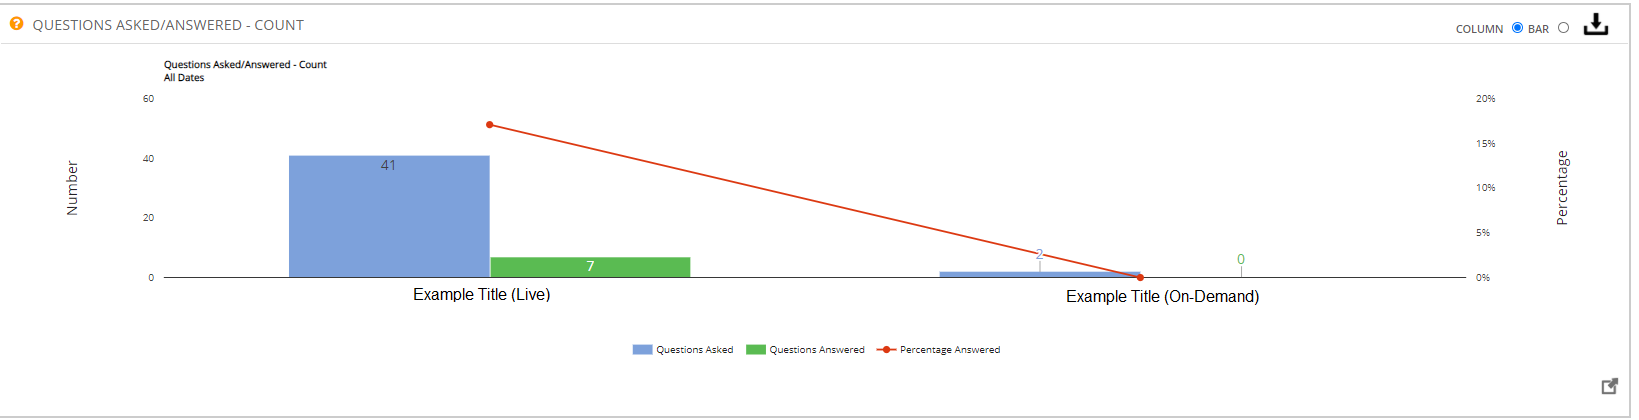
QUESTIONS ASKED/ANSWERED - COUNT
This graph will show any questions that have been asked by the attendees if you have Ask a Question ticked for your event. Multiple graphs will show depending on how many events are included in your multi registration event.
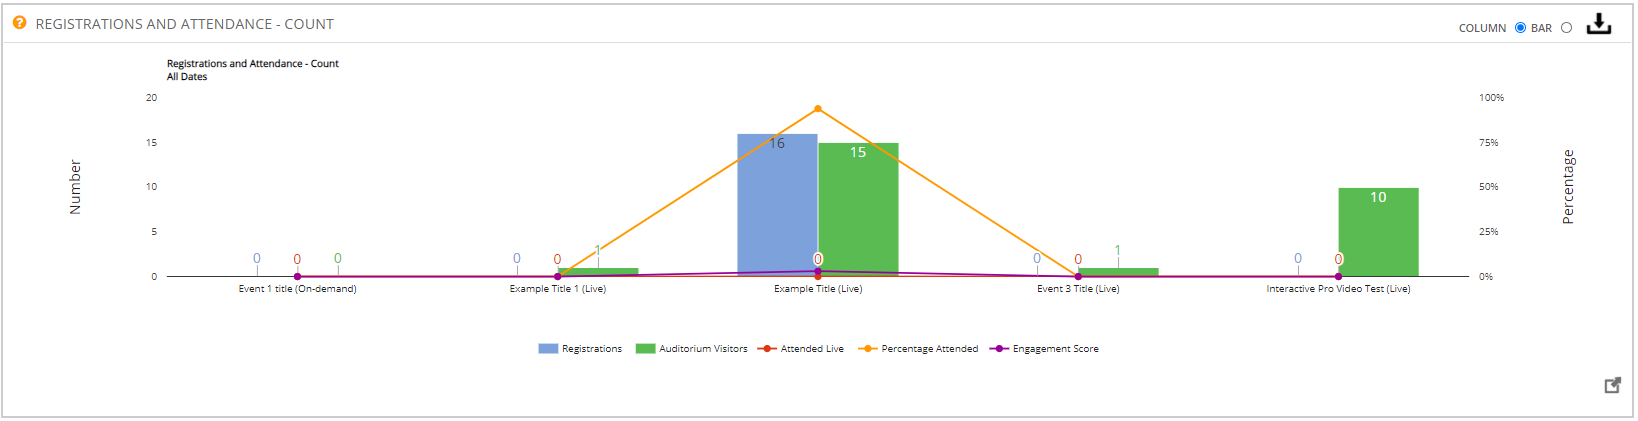
REGISTRATION AND ATTENDANCE - COUNT
This graph shows the number of people registered vs the number of people who attended (hit the auditorium page), along with statistics on attended live, percentage attended, and engagement score.
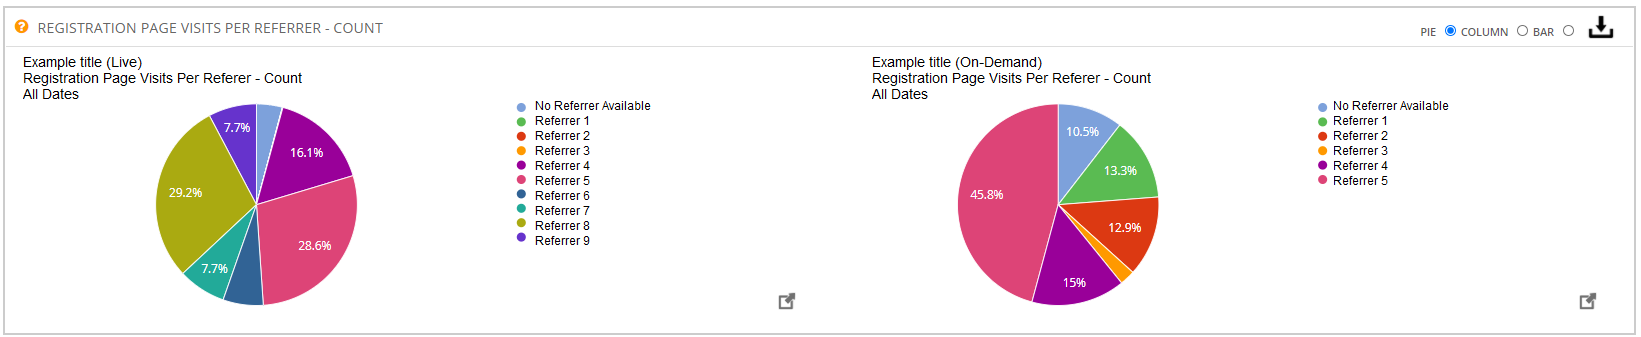
REGISTRATION PAGE VISITS PER REFERRER - COUNT
This graph shows you a count of registrations page visits, which is broken down by the referrer. For more information on how you set up a referrer for your event, please click here.
Choosing your Reports
If you want custom reporting, i.e. you want to break down the multi-registration event further and select only certain events within the multi-registration event to gain more reporting on, then this is possible!
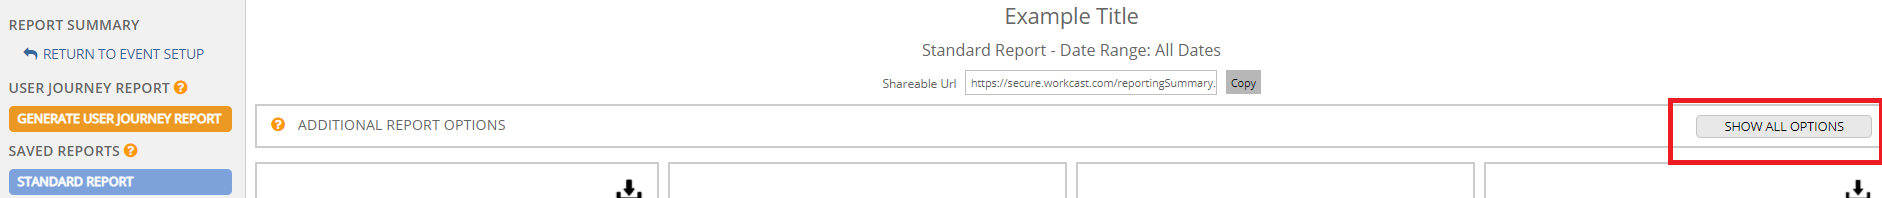
1. The first thing you will need to do is to press show all options
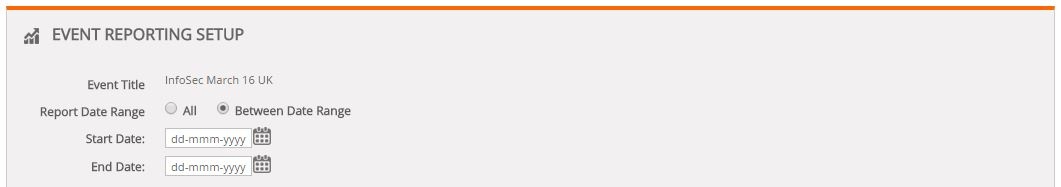
2. Then you would select the data range of the report. This can either be all data for all events in the multi registration event or data within a specific range, using the calendar buttons.
3. You can then either keep it to the standard reports, or you can change it to include additional reports/remove some reports and add some reports, whatever you choose.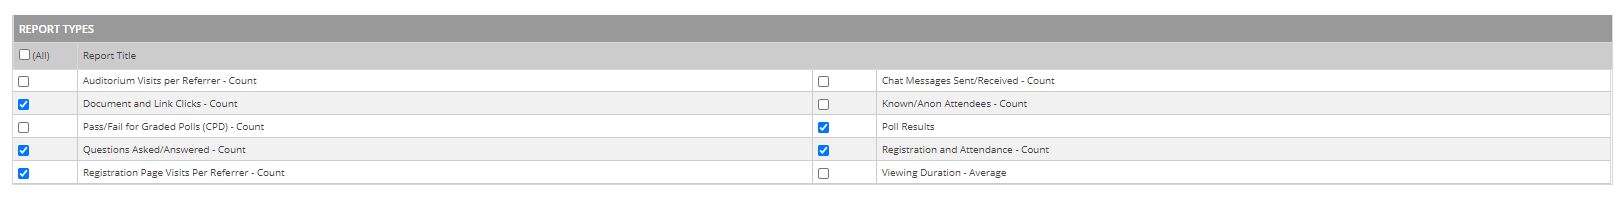
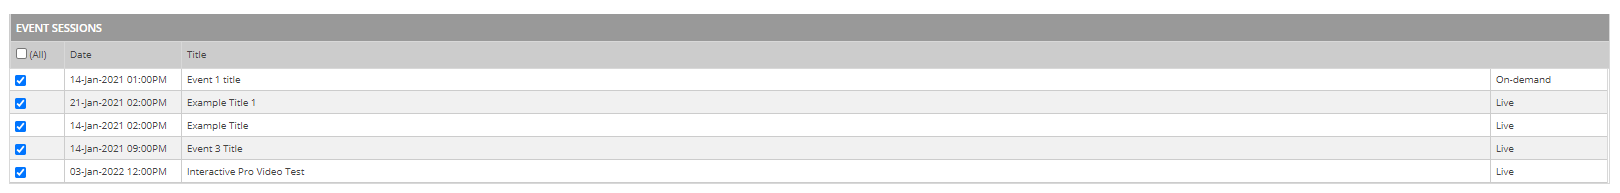
4. Now you can select the event session(s) within your multi-registration event that you wish to generate a custom reporting URL for. This can be chosen by clicking on the (All) checkbox, or by selecting individual events by checking the boxes that apply to those events.
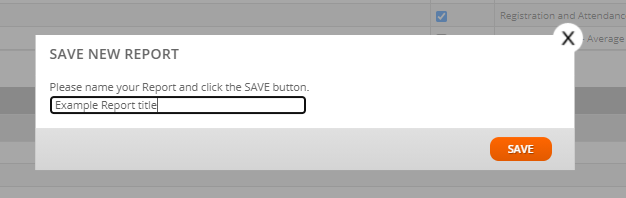
5. Once you are happy you have selected all the reports and event sessions required, please click on the green Save New button.

6. Now you can give your new reporting URL a title, we would recommend it to be specific, for example: "Average duration of all events" or something relevant for you.
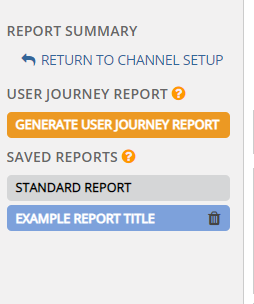
7. This new reporting URL will now show on the left-hand side, along with your standard report. This will now stay there and you can refer back to it at any time.
Understanding your Custom Reports
These are the reports which you can select from the Show All options.
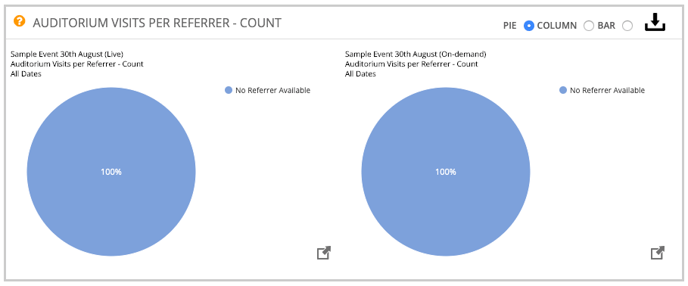
AUDITORIUM VISITS PER REFERRER - COUNT
This graph shows a count of auditorium visits broken down by referrer for each event session selected.
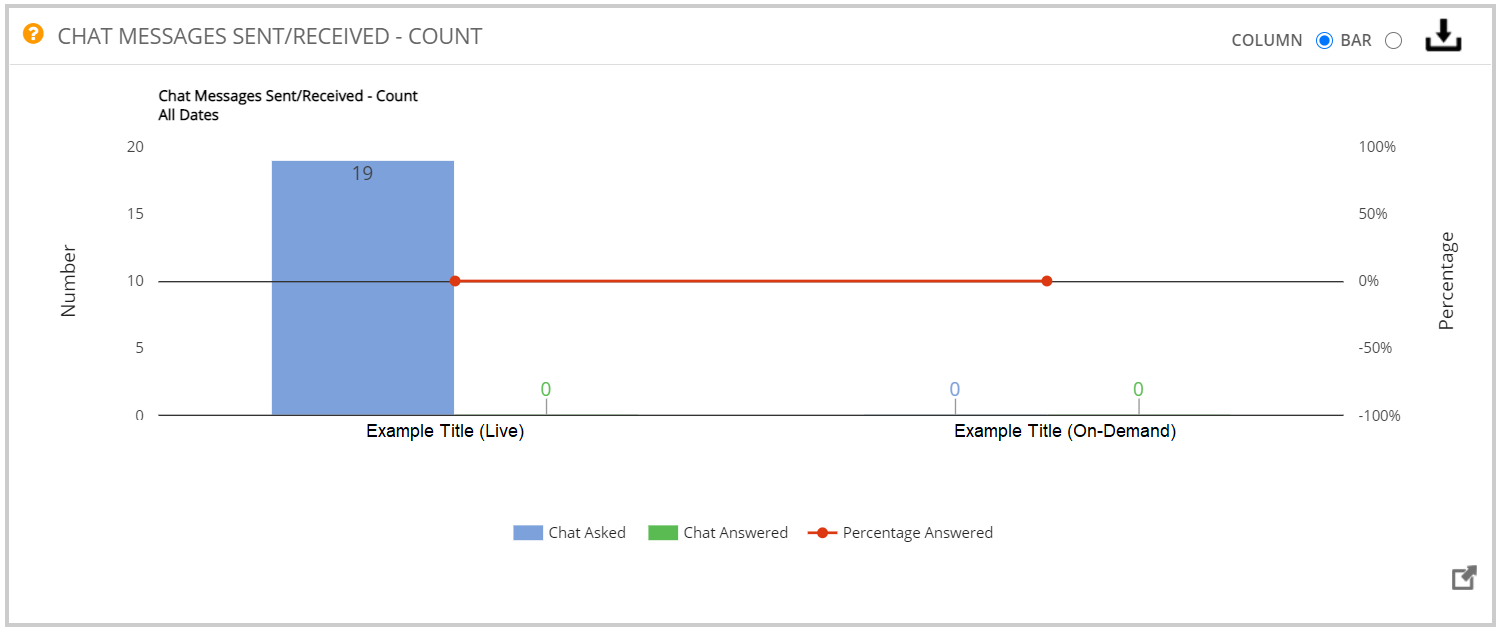
CHAT MESSAGES SENT/RECEIVED - COUNT
This graph will show any questions/chats that have been submitted by the attendees if you have Include Participant Chat ticked for your events.
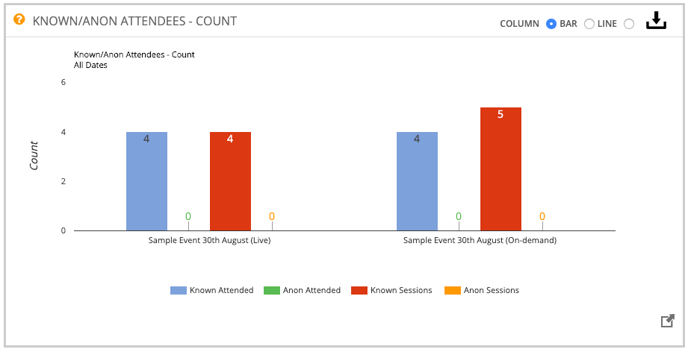
KNOWN/ANON ATTENDEES - COUNT
This graph shows the known compared to anonymous attendances and sessions. Anonymous would appear if you do not have a registration form gateway, or if you have chosen to do an Embed event, but not set up that secure gateway.
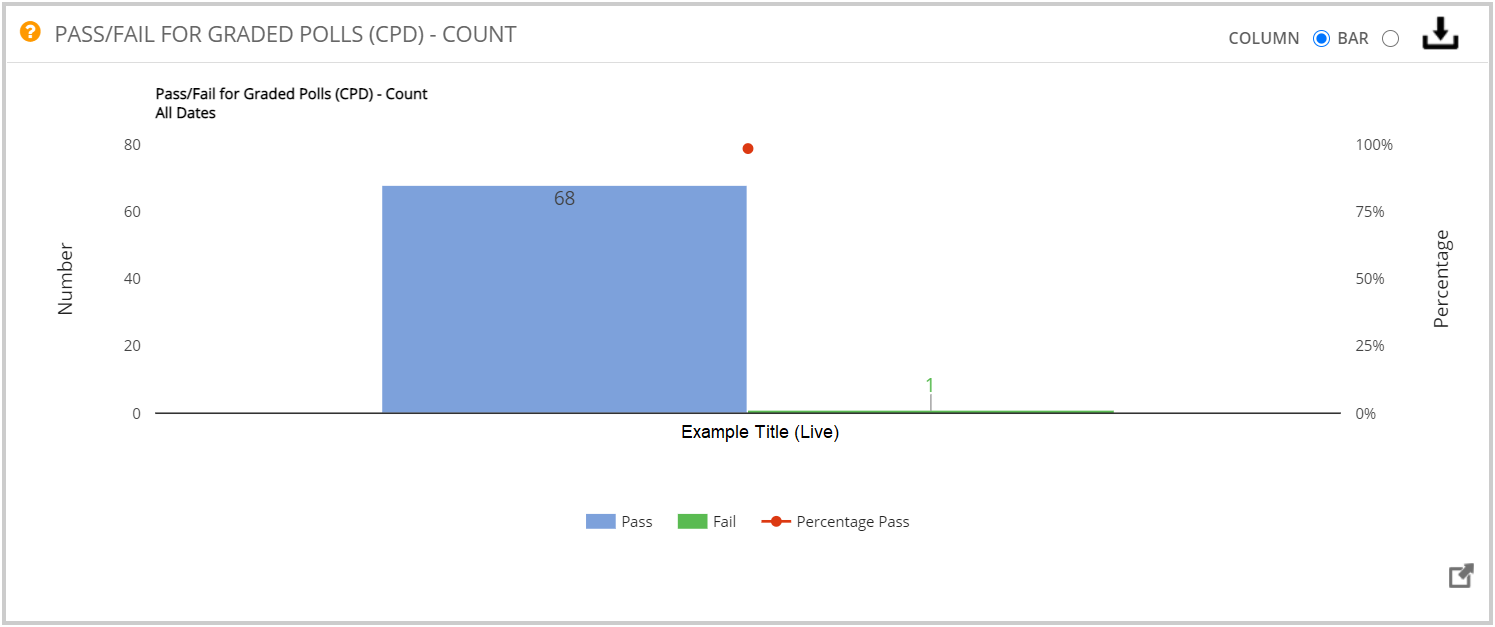
PASS/FAIL FOR GRADED POLLS (CPD) - COUNT
If Graded Polls have been included, the pass/fail results of these will be displayed. Want to know more about Graded Polls? Click here!
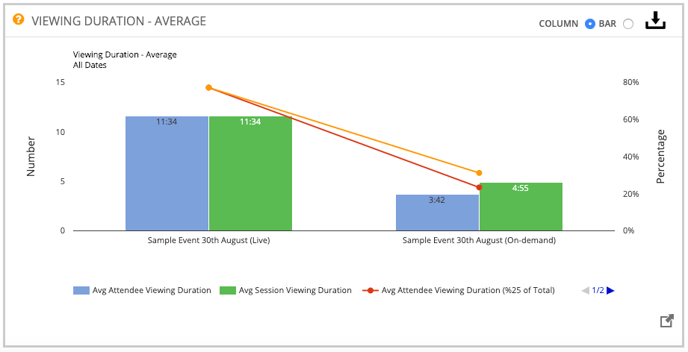
VIEWING DURATION - AVERAGE
This graph shows the average viewing time per attendee (the total amount of time viewed divided by the number of attendees) and the average viewing time per attendee web session (the total amount of time viewed divided by the number of attendee web sessions) for each of the event sessions included in the report.
Downloading/Generating Reports
1. To generate a spreadsheet for any of the above standard reports, please click on the Download button to the side of the report.
2. Once pressed, a box will pop up asking you to proceed
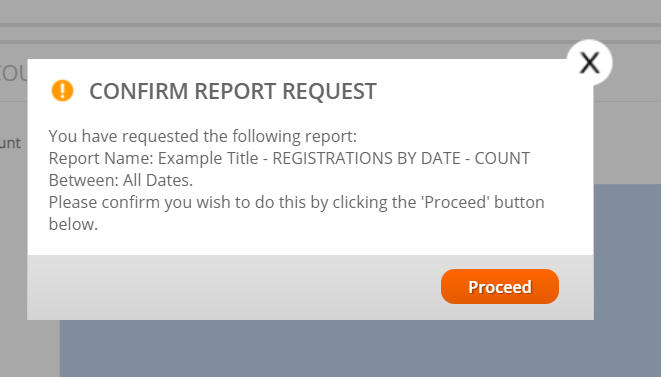
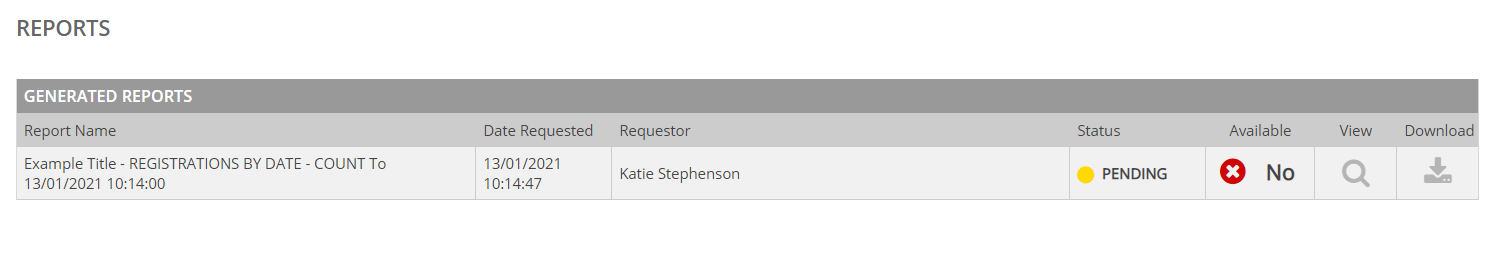
3. Press Proceed, and it will take you to a page where the report is generating. It will first say pending. After around 1 minute, it will change to green Available and Yes
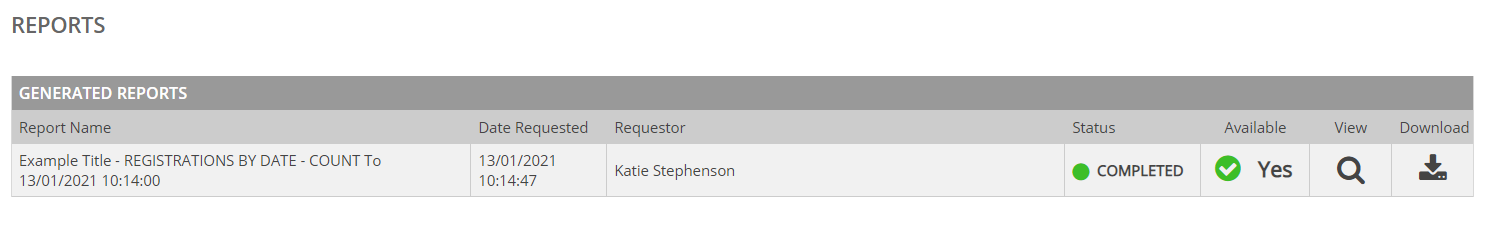
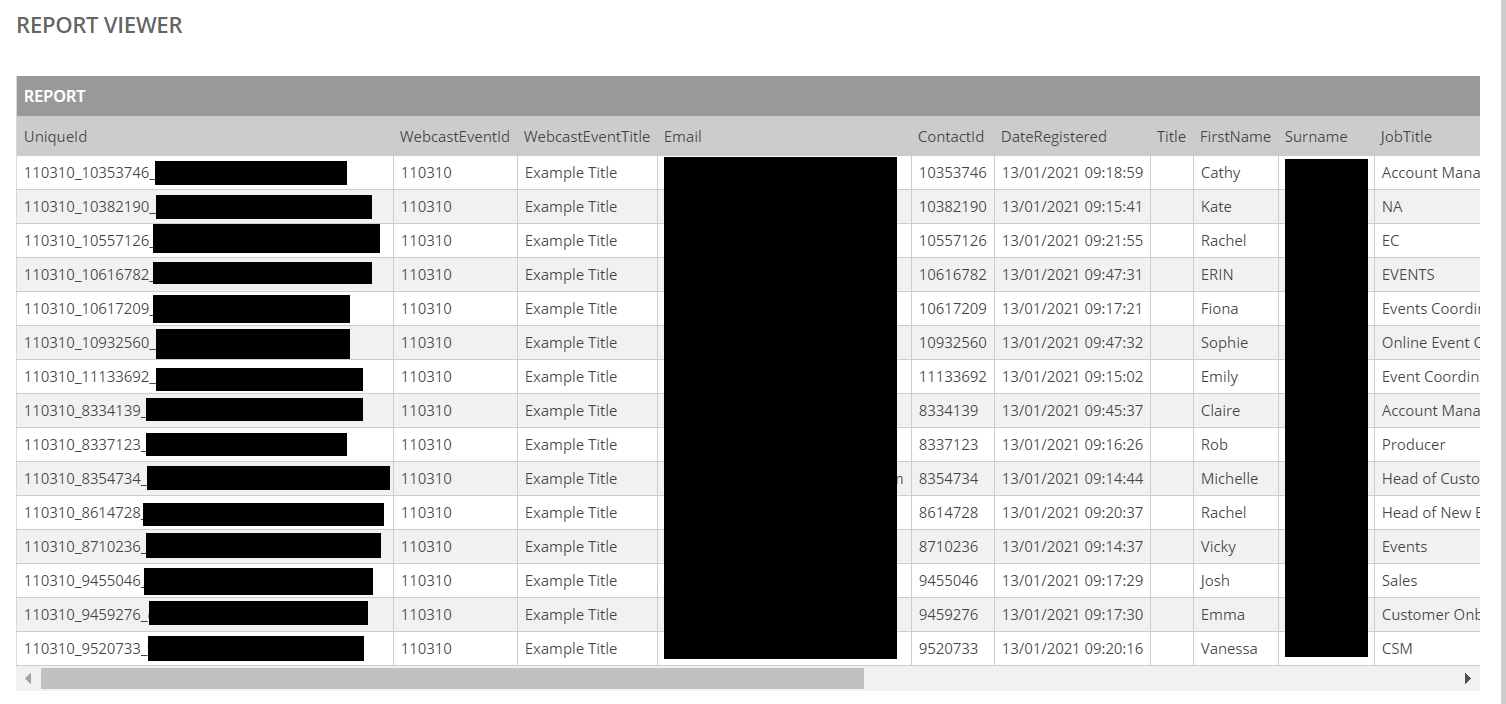
4. You then have the option to either press the View button which shows you the online version of reporting within the platform. Or you can press the Download button which will download a zip folder of the data and allow you to open the report within an Excel sheet.
View *personal data blocked out for the purpose of this page
Download *personal data removed for the purpose of this page
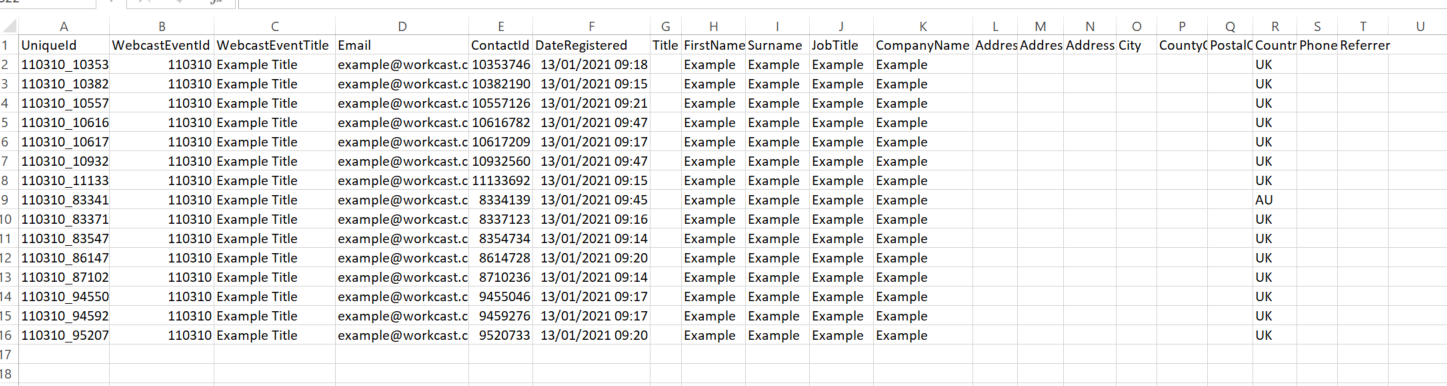
User Journey Report
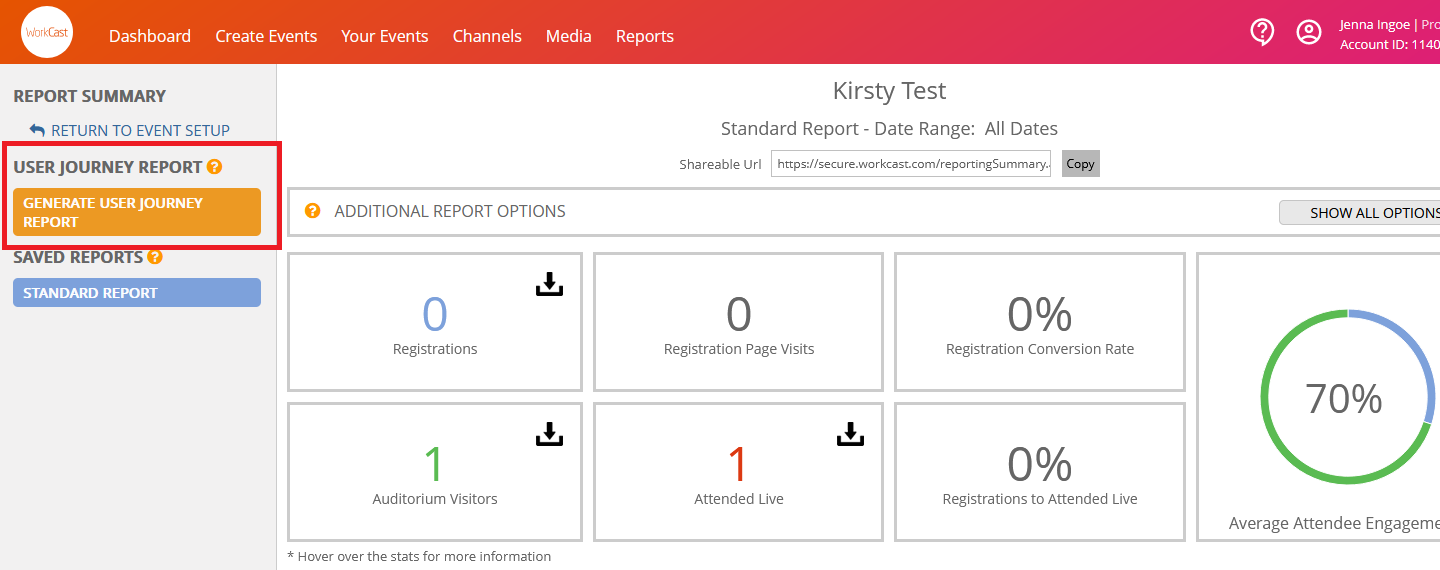
Each of the mentioned reports will allow you to generate an individual report for that section by clicking on the report button of the graph you are looking at. However, if you wish to have all the statistics grouped together, you are able to generate a user journey report which can be generated by following the steps below:
1. Click on the Events tab
2. Select the multi-registration event that you require an extended User Journey Report.
3. Click on Generate User Journey Report button.
4. On the popup, check the box that states Create Extended Report and click Proceed.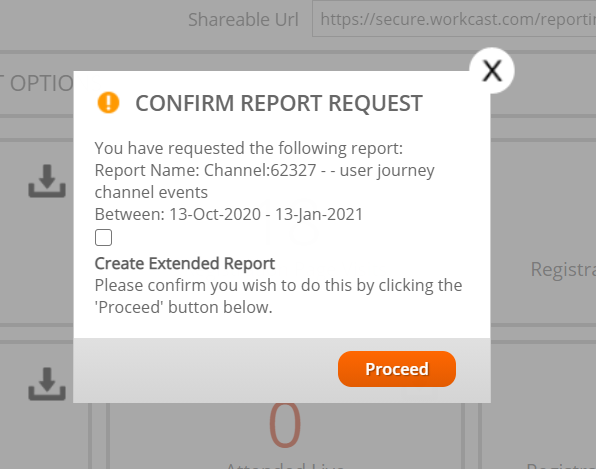
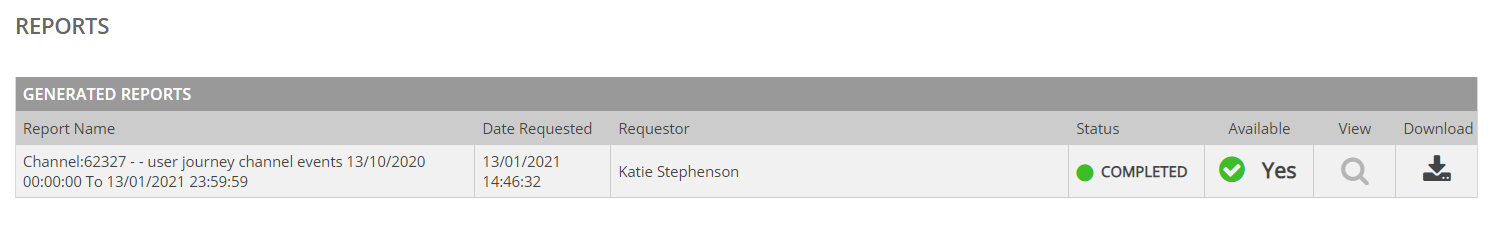
5. You will be taken to the Reports Tab. 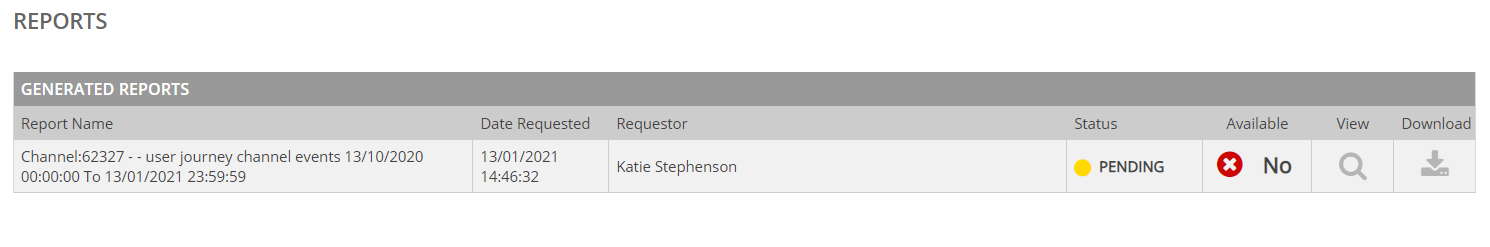
NOTE: The User Journey Report is generated at midnight (UK Time). This report will be available within Generated Reports for 3 days, it will then expire and remove from the Generated Reports list.
6. You can then log back into the account after midnight UK time to view or download the details. (As long as you generated it prior to midnight UK time)
7. After midnight UK time, the red cross will be replaced with a green tick and a download button will appear. This will allow you to download the document into an Excel document format for 3 days before it expires.
8. Please note that two excel documents will be available. The first document will be the Channel Event Activity Report and the other will be the Channel Events Report.
Channel Event Activity Report contains:
- IP/Browser standard information
- Viewing attended date and time
- Documents & link information
Channel Events Report contains:
- Standard registration fields
- IP/Browser standard information
- Viewing duration's & date attended/date left the page
- Engagement percentage
Notes
After the event has taken place, and the on-demand has been created for each, you may want to revert back to the single event-based reporting, as to ensure the multi-registration URL is correct, we would remove the live sessions from it, and only keep the on demands, so live reporting would remove itself from that multi-registration event reporting.