All WorkCast events have a reporting dashboard available to view and share. Here you can see graphs depicting registration, attendance and engagement data.
Quick Links
Understanding the reports available
How is attendee Engagement calculated
How to access event reports

Within your account, click into the Your Events tab and locate the event you’d like to view reporting on.
To the left of the screen you will see EVENT REPORT, click this to view the reporting dashboard.
The page will reload to the event reporting dashboard where you will find all available reports for your event.
How to Share Reporting URL
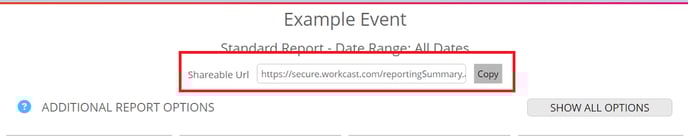
To share the event reporting with sponsors or non producer users click Copy on the Shareable URL.
This will provide a URL which allows access to the reporting dashboard.
Customise reporting dashboard
 You can create custom reporting dashboards on an event basis within your event reporting. This can be to filter to specific dates or separating Live from On-Demand. To do this click show all options and select from the options available. click here to learn how to do this.
How to download reports
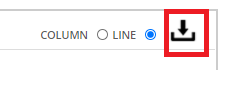
Most reports within the dashboard are available to download as a .csv file. This is indicated by the download icon located to the right of the report.
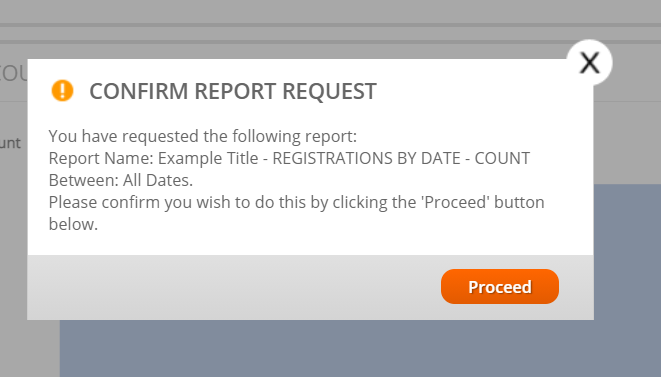
To generate the .csv file, click the icon to download. A pop up with appear asking you to confirm you’d like to download, click proceed.
The page will reload to show you the Generated reports page where you will see a list of any reports you requested that day.

As the report generates you will see the Status as Pending

When the report is ready this will change to green Available. You can then download the .csv file by clicking the Download icon which will contain specific user data.
**Questions Asked/Answered is now emailed directly to user.
Understanding the reports available
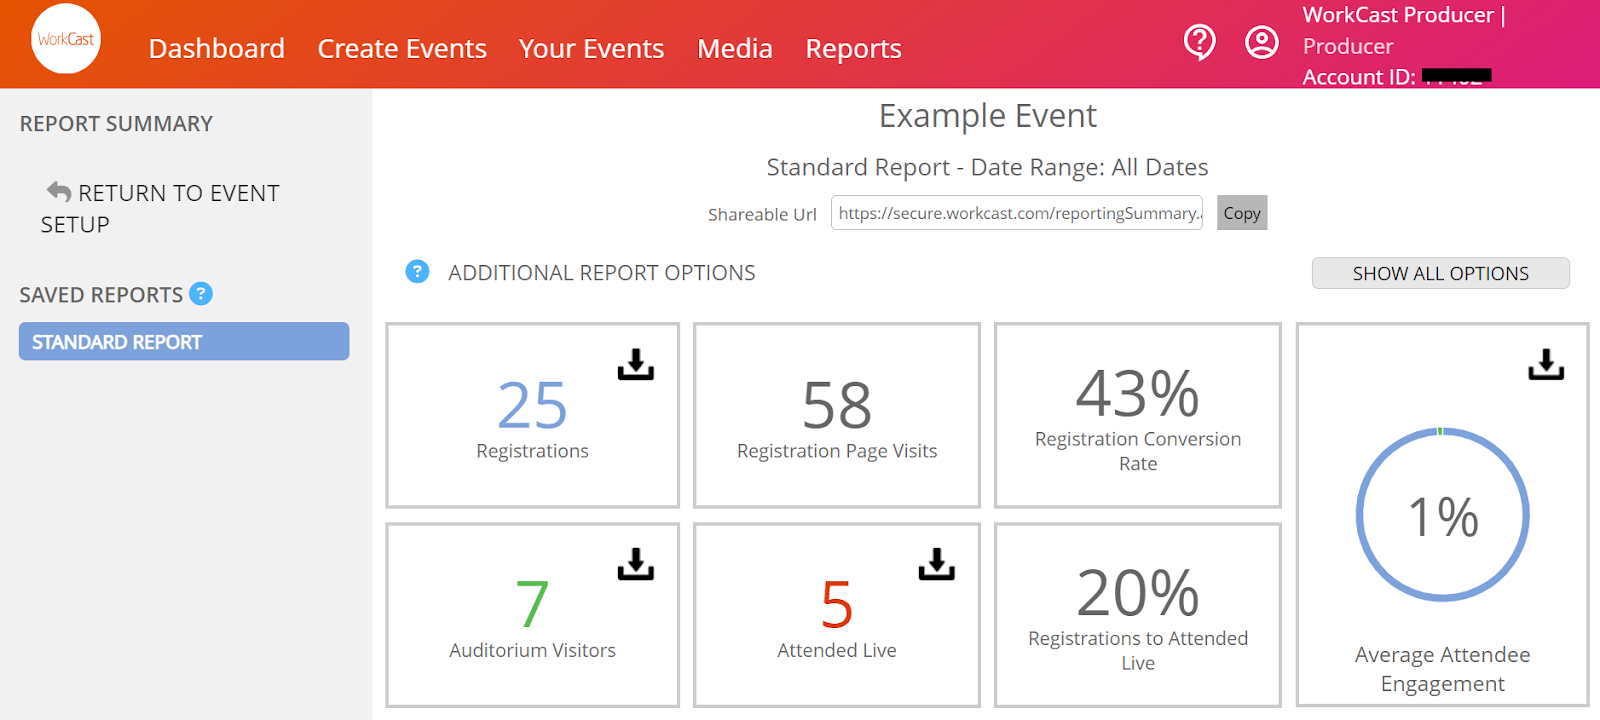
Top Level stat's - To the top of the report dashboard you will find 7 top level stats.

These are:
1. Registrations - This shows the total number of unique registrants for the event.
If an individual registers more than once with the same email address their original details will update leaving them to appear as a single registration.
2. Registration Page Visits - The total number of times the event registration page was visited.
A single person may view the registration page multiple times which will increase the number of page visits number.
If users are registered on a non-WorkCast registration page i.e via API or via a bulk upload, you may see a lower registration page visits number as they’ve not accessed the WorkCast registration page.
3. Registration Conversion Rate - This is the total number of registrations divided by the total number of registration page visits.
This statistic will help you understand if items such as your event title, amount of content, and the number of registration fields are helping to convert visitors to the page into registrations.
4. Auditorium Visitors - The total unique number of attendees who have visited the main event presentation page at any time prior, during, or after the live event date and time.
5. Attended Live - The total unique number of attendees who have attended the event during the live broadcast event date and time.
This includes 1 hour prior and 1 hour after the event duration time.
Important: Attended Live stats will update 1 hour after the end duration time. I.e if the event was 10am with a duration of 1 hour (11am), the attended live stats will be available at 12pm.
6. Registration to Attended Live Conversion Rate - The total number of registrations divided by the total number of live attendees.
7. Average Event Engagement - The total event engagement percentage is based upon the average individual attendee's engagement scoring. For information on how this is calculated click here.
Standard Reports - The standard reports that will show automatically for you are the following:
ATTENDEES PER MINUTE - COUNT
This graph shows attendee numbers counted at each minute throughout the duration of the event.
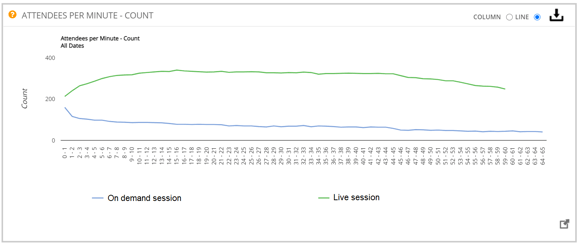
Each event session (Live/On-Demand) is reported as an individual line. You have the option to choose a column or line view of the graph. If your event has broadcasted and it is now on-demand, it will show you 2 lines.
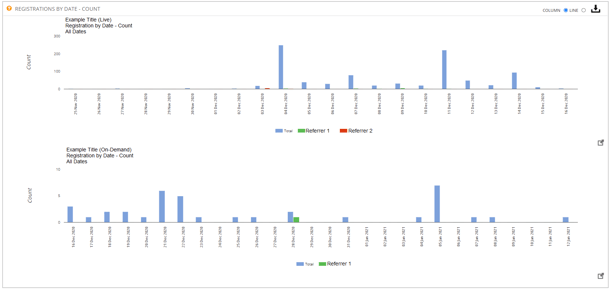
REGISTRATIONS BY DATE - COUNT
This graph shows you all registrations for your event, by date.
If your event has broadcasted and it is now on-demand, it will show you 2 graphs. If you have set up any registration URL referrers, these will also show in the graphs.
DOCUMENTS AND LINK CLICKS - COUNT
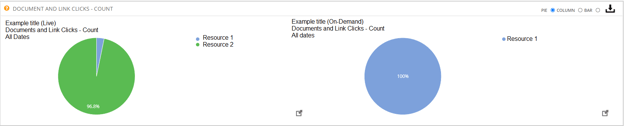
This graph shows the number of documents and links that have been clicked on via the resources tab in the event auditorium page.
POLL RESULTS
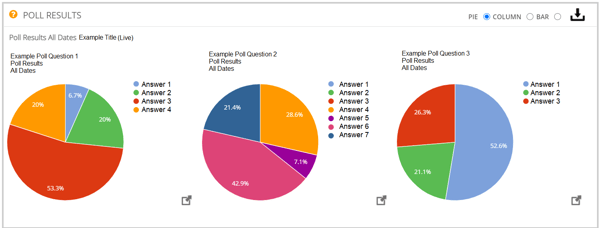
This graph shows you the results of polls that were asked during the event.
If you have polls added to the on-demand session of your event, a 2nd graph will appear with the on-demand poll results.
Note: You will not gain a pie chat for any text answer polls, but the data will appear when you view/download the report.
QUESTIONS ASKED/ANSWERED - COUNT
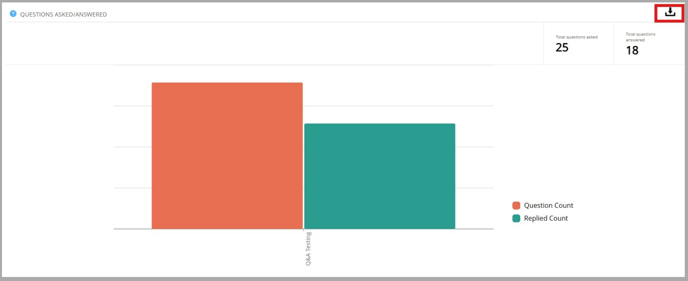
Scroll down to the QUESTIONS ASKED/ANSWERED section to view the details of your question.
The number of questions asked and answered for each session in your event will be displayed both numerically and in a bar chart. You can download the details of each question and response by clicking the download icon in the top-right corner of the report.
The report will be emailed to the address associated with the Producer account you are logged in with. If you're accessing the report via a shareable reporting URL, you will be prompted to enter the email address you'd like the report sent to.
Once received, the download link in the email will be valid for 7 days.
REGISTRATION AND ATTENDANCE - COUNT
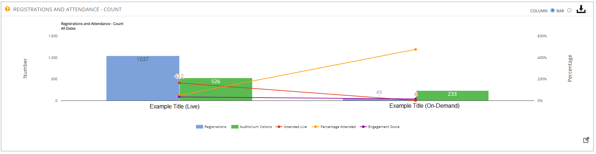
This graph shows the number of people who Registered and Attended along with statistics on attended live, percentage attended, and engagement score.
This Report, when downloaded, provides the most data on the individual user.
You will see 2 graphs if the event has broadcasted and is now available on-demand.
REGISTRATION PAGE VISITS PER REFERRER - COUNT
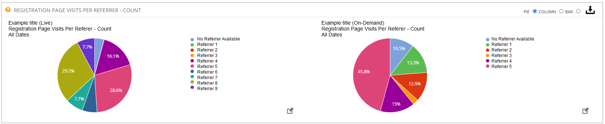
This graph shows you a count of registrations page visits (Not successful registrations), which is broken down by the referrer.
To see who registered using your referrer code please download the Registration, Registration attendance report.
For more information on how you set up a referrer for your event, please click here.
How is attendee Engagement calculated
Individual attendee's engagement scores can be viewed on the Auditorium Visitors, Attended Live and Registration and Attendance reports.
Engagement is calculated on an individual bases, based on the following:
Total Individual Engagement Score = Event Viewing Duration % + Polls Answered % + Question or Chat submitted % + Document/Link Download %
Break down:
Event viewing duration = 60% - If the attendee views the entire event (based off the event duration you set) they will receive the full 60%. If they view half of the event they receive 30%.
Polls Answered = 10% - if the attendee answers 1 or more poll question they will receive full percentage.
Submitted a question/chat = 20% - If the attendee submits 1 or more questions they will receive full percentage.
Document & Link download = 10% - If the attendee clicks to download 1 or more resource they will receive full percentage.
NOTE: If your event is configured without one of the above event elements then attendees will never gain an engagement score of 100%. Attendees will stay engaged during an event the more they can interact with different event elements.