Overview
Event reporting is available for all WorkCast plans, Business, Business Pro, and Enterprise plans. It allows you to go into your online reporting dashboard and customize new reporting URL's of your choice for every event.
Choosing your Reports
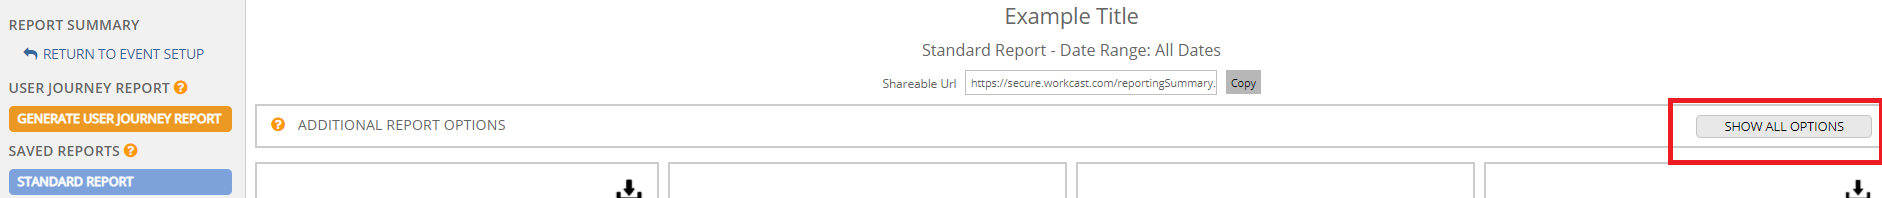
To customize your report you should click on the Show all options button to show all report options available to you.
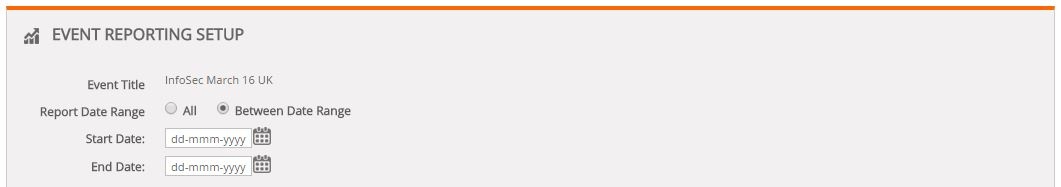
1. The first thing you will need to do is to select the data range of the report. This can either be all the data for that event or a custom data range, using the calendar buttons.

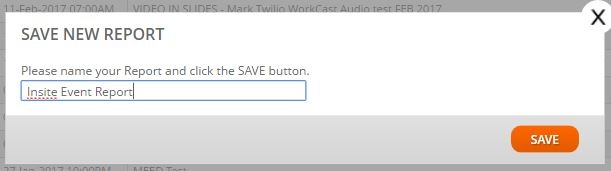
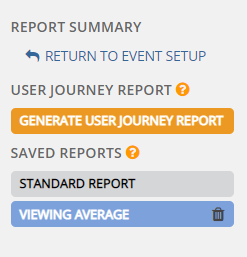
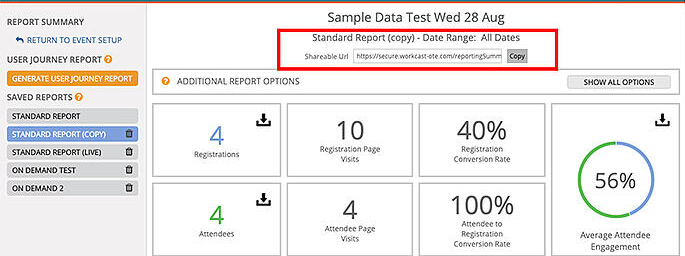
4. Once you are happy you have selected all the reports required, please click on the Save New button. You will be prompted to give this report a name, this is so you can navigate back to the report filter at a later date.

Your report is now visible and you have also created a shareable URL, and will appear along with your standard report on the left-hand side.
Custom Reports
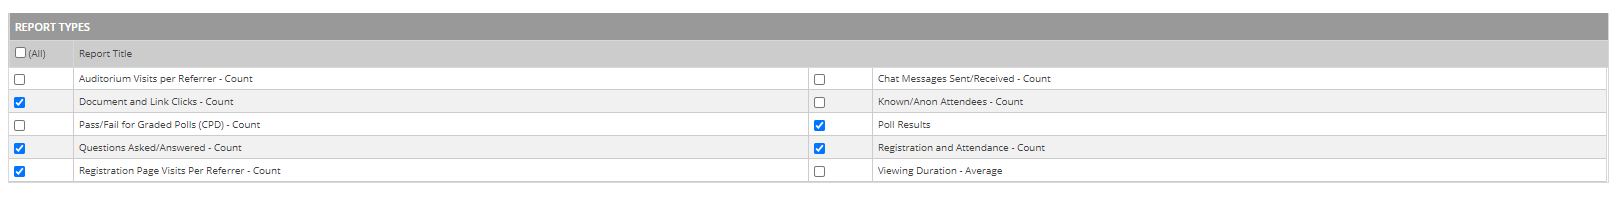
These are the reports which you can select from the Show all options.
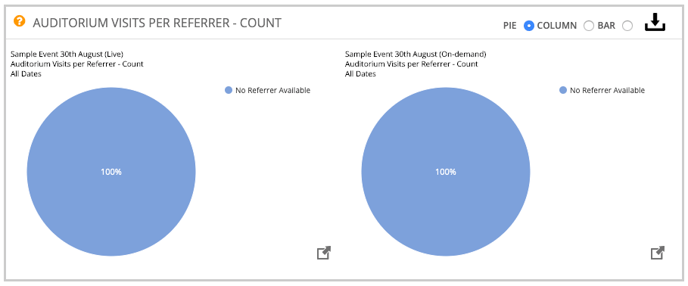
AUDITORIUM VISITS PER REFERRER - COUNT
This graph shows a count of auditorium visits broken down by referrer for each event session selected.
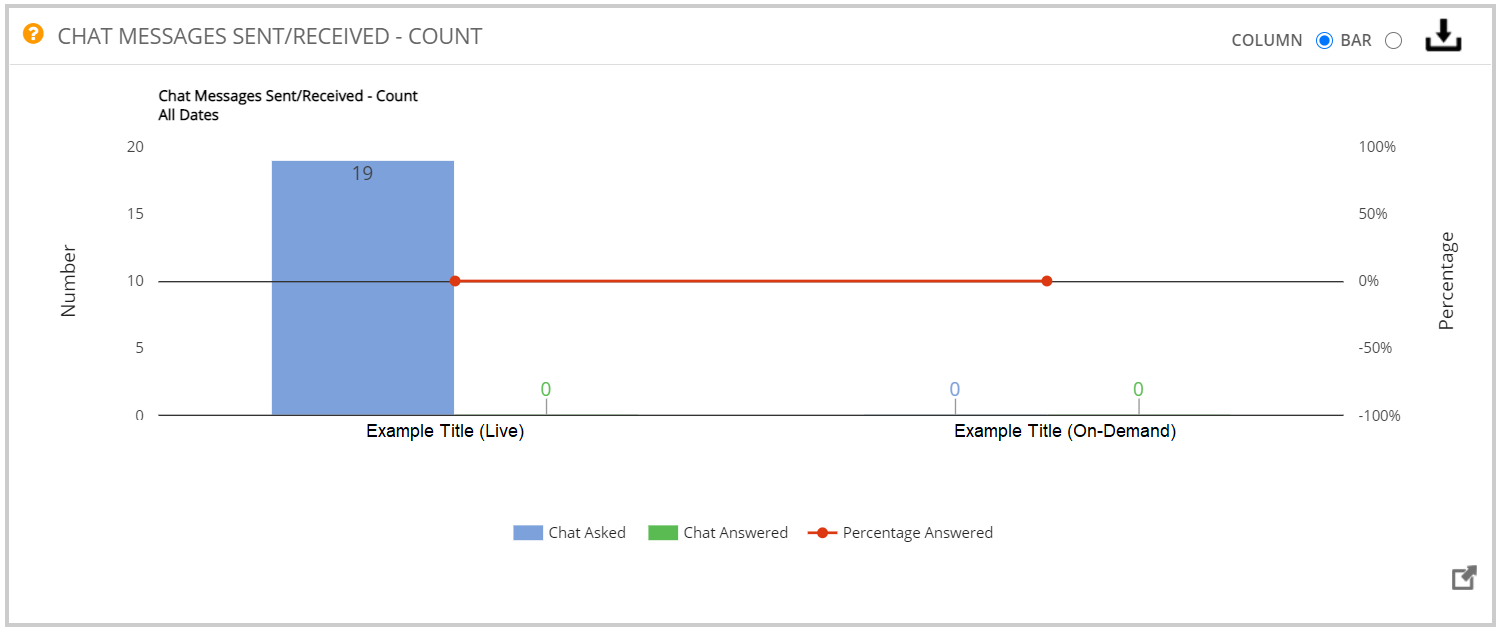
CHAT MESSAGES SENT/RECEIVED - COUNT
This graph will show any questions/chats that have been submitted by the attendees if you have Include participant chat ticked for your event.
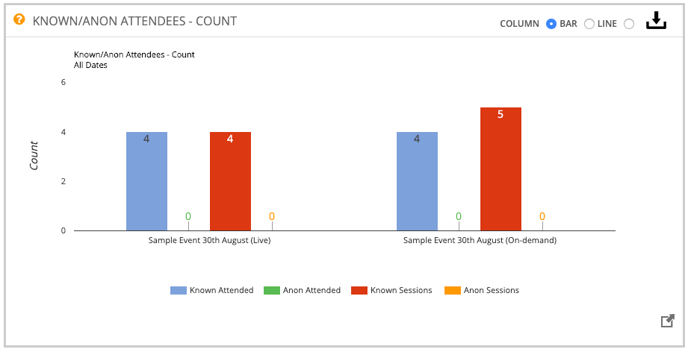
KNOWN/ANON ATTENDEES - COUNT
This graph shows the known compared to anonymous attendances and sessions. Anonymous would appear if you do not have a registration form gateway, or if you have chosen to do an Embed event, but not set up that secure gateway.
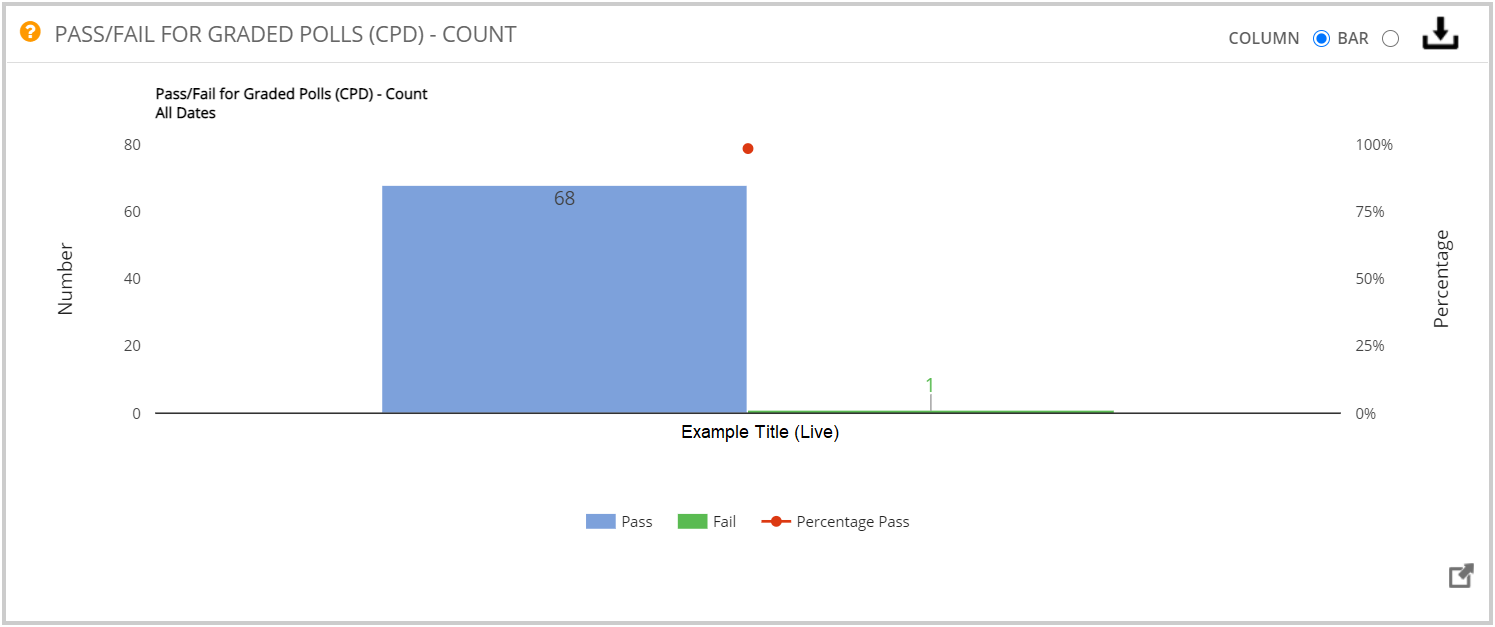
PASS/FAIL FOR GRADED POLLS (CPD) - COUNT
If Graded Polls have been included, the pass/fail results of these will be displayed. Want to know more about Graded polls? Click here!
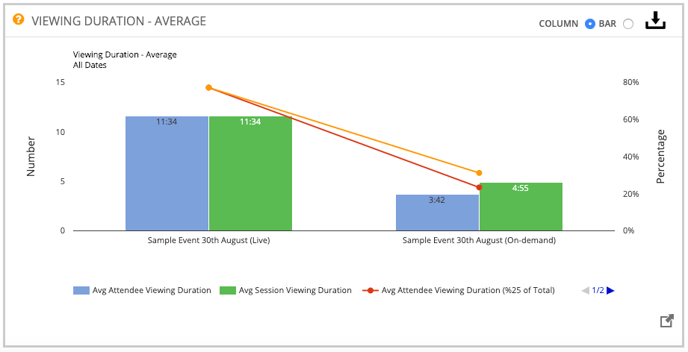
VIEWING DURATION - AVERAGE
This graph shows the average viewing time per attendee (the total amount of time viewed divided by the number of attendees) and the average viewing time per attendee web session (the total amount of time viewed divided by the number of attendee web sessions) for each of the event sessions included in the report.
Sharing your Reporting URL's
Users are able to share a direct reporting URL allowing viewing of a specific reporting page without requiring a platform login. The report can be tailored to include specific reporting filters as demonstrated above.
These links will allow access to the specific event report page without the ability to navigate to any other areas within the WorkCast Platform.
How it will look once the URL is clicked on: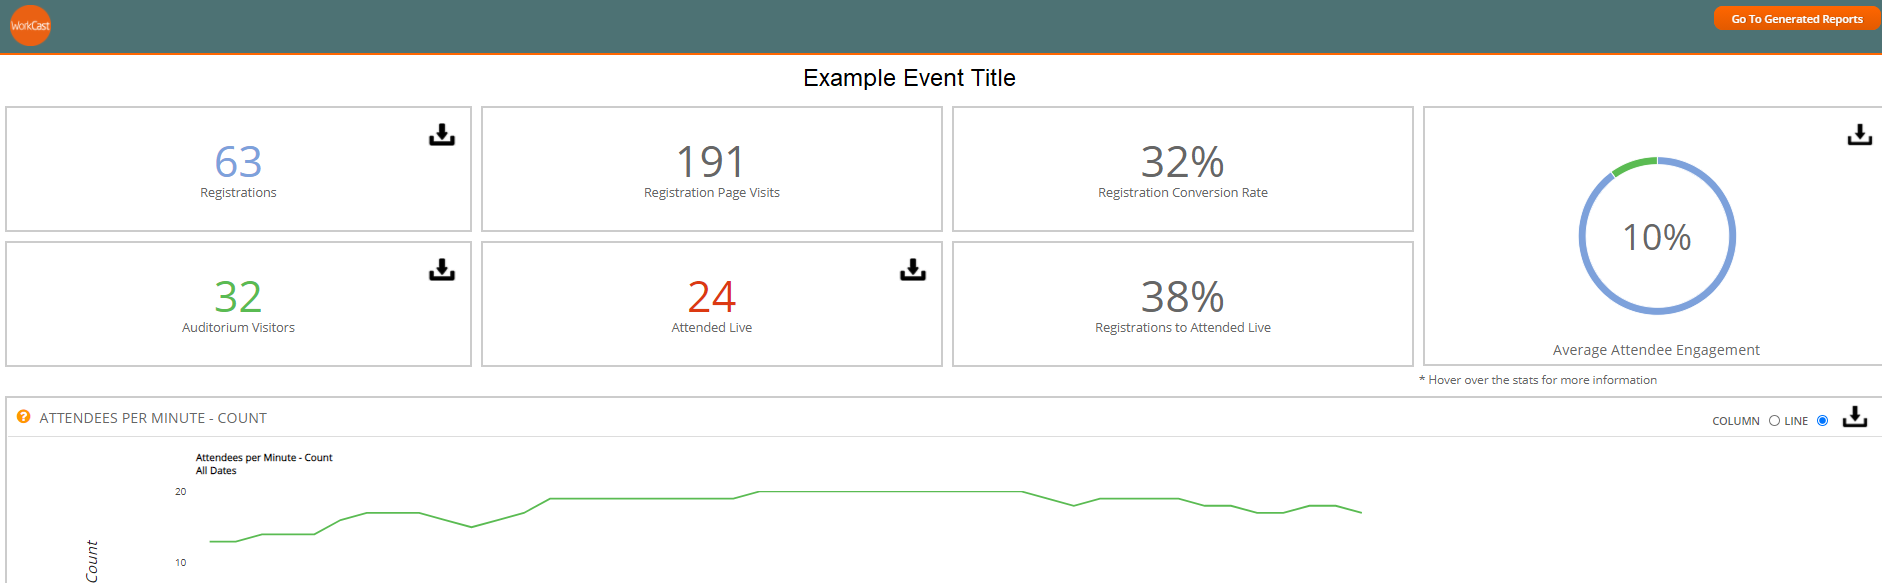
As you can see, no other tabs are at the top to navigate to other events. They are able to download reports that are within that reporting URL, and if they have downloaded reports before via this link, they are able to Go to generated reports.
*Please note once a url is generated this is valid for 3 months. If viewing after that time frame a new url will need to be generated*