This is an article that will go through the best practices for Virtual Event Reporting
Overview
Virtual Events can generate a large amount of data due to the number of sessions involved.
We strongly recommend that, once all sessions have been created within your Virtual Event, you customise your reporting by creating new reporting URLs for each session that will receive attendees or page hits.
How to access your Virtual Event reports
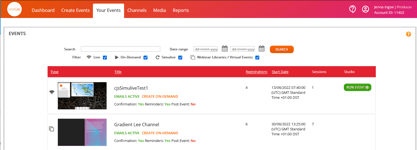
Your Virtual Event will always be located within the Events tab

You will find it via the Title that you have set it, and/or you can search via the Date range.
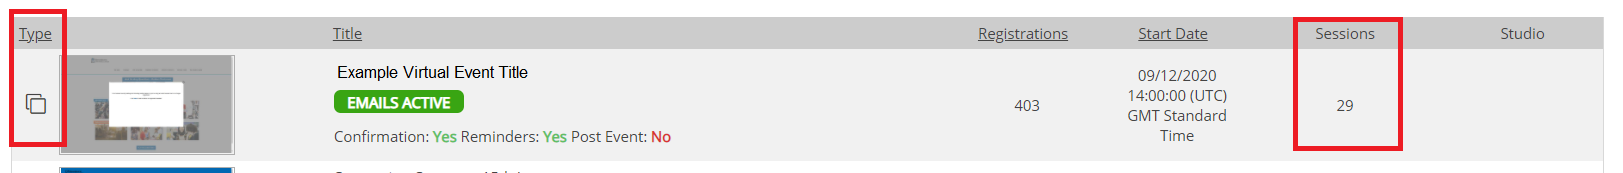
You will see your Virtual Event via the title/date/time associated, it will also have more than 1 session in it and will have a thumbnail on the left that shows it has multiple sessions included.
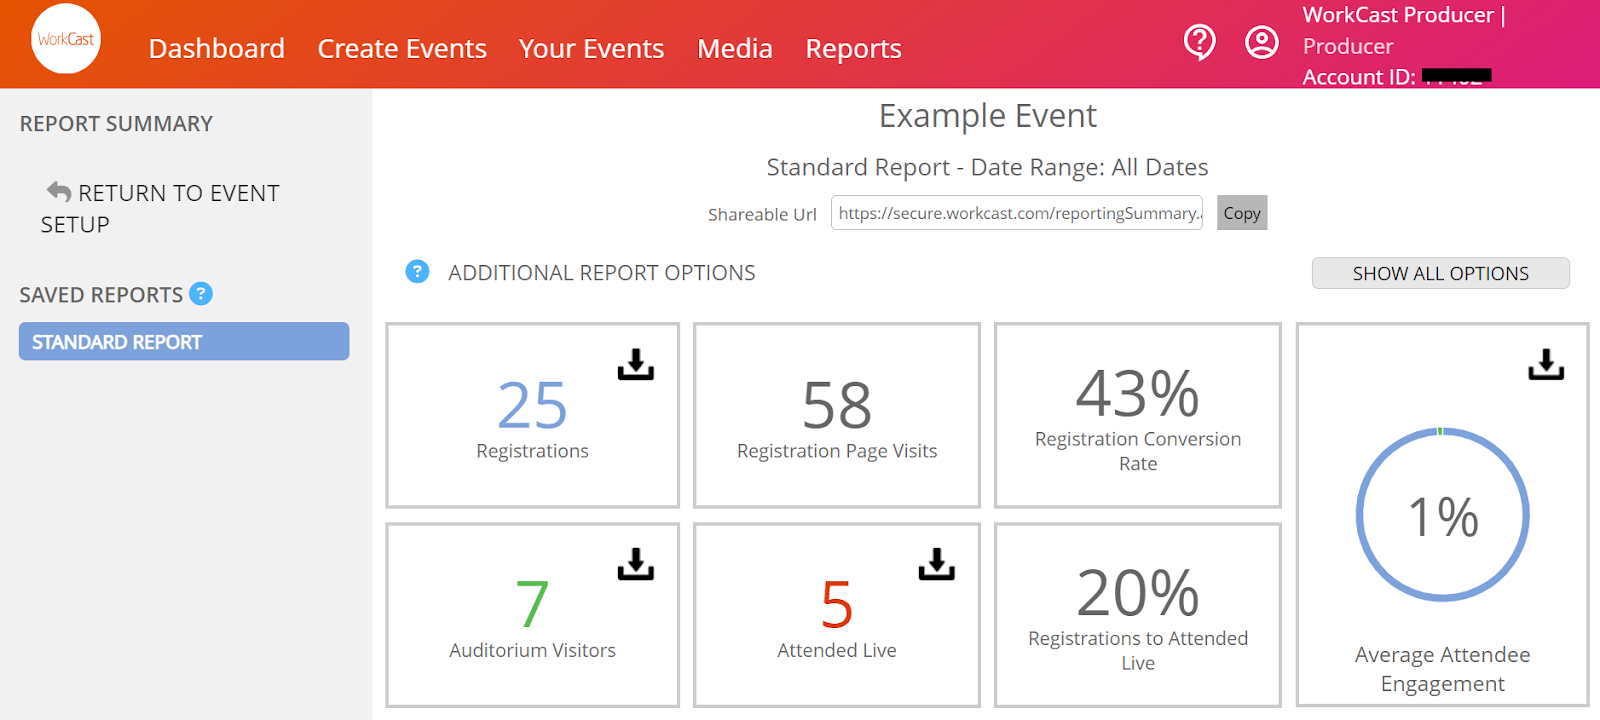
Once you have clicked into the Virtual Event, you need to click into Report Setup
You will first see top-level statistics from your whole Virtual Event.
Creating reporting URL's for every session
We recommend you create new reporting URL's within your Virtual Event for each session. This will break down data for you making it easier to understand and download.
Note: Registration data will always be against the top session, which will be called Lobby.
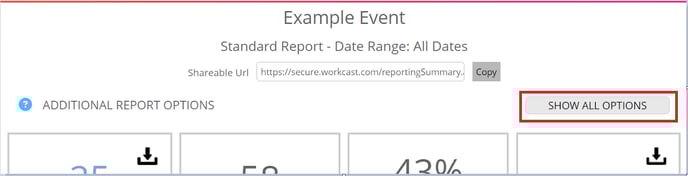
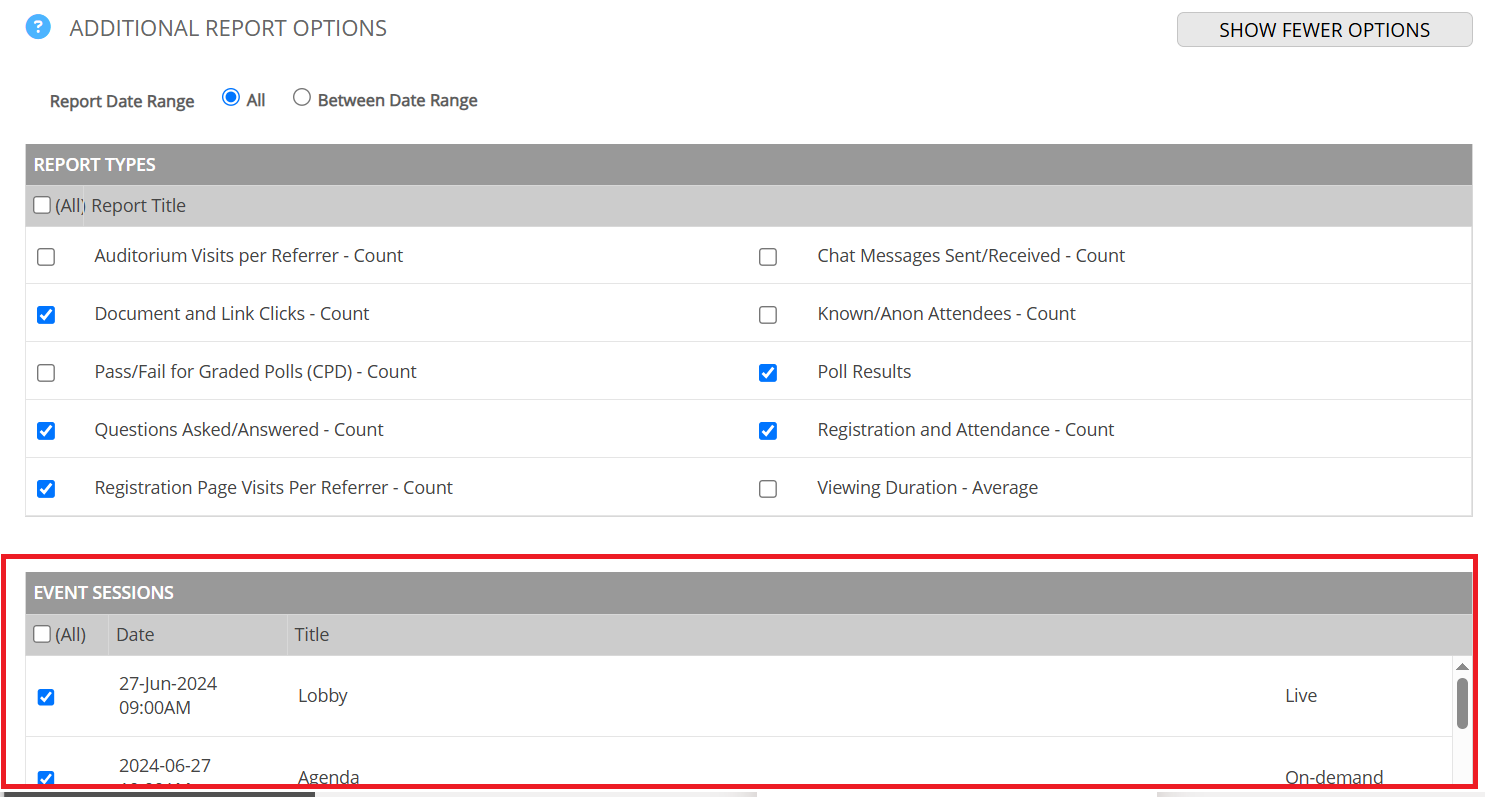
Within the event reporting locate and click Show All Options
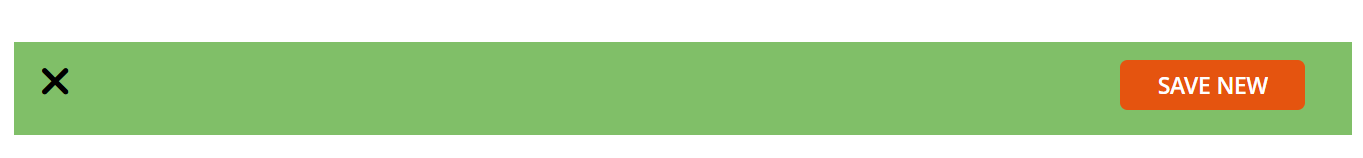
Once you are happy you have selected the session/sessions required, please click save new button.
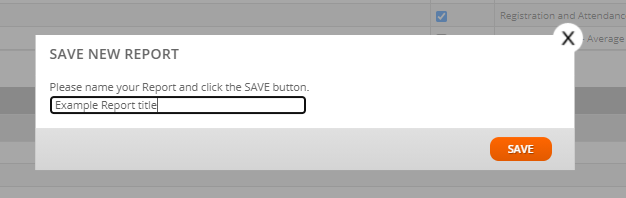
In the pop up give the reporting dashboard a title
We recommend it is specific to the session/group of sessions. i.e Lobby only - Registrations.

Repeat the above for all Sessions or groups of sessions.
This new reporting dashboard will now show on the left-hand side, along with your standard report and can be accessed at any time.
Eventually, we'd expect to see a list of all sessions available.
This allows you to look at reporting quickly for specific sessions within your Virtual Event, rather than downloading an overall report within your Standard Report and having to filter down within excel.
Understanding all reports available
Click here to see the reports available